. 2022 Aug 2:M22-0803. doi: 10.7326/M22-0803

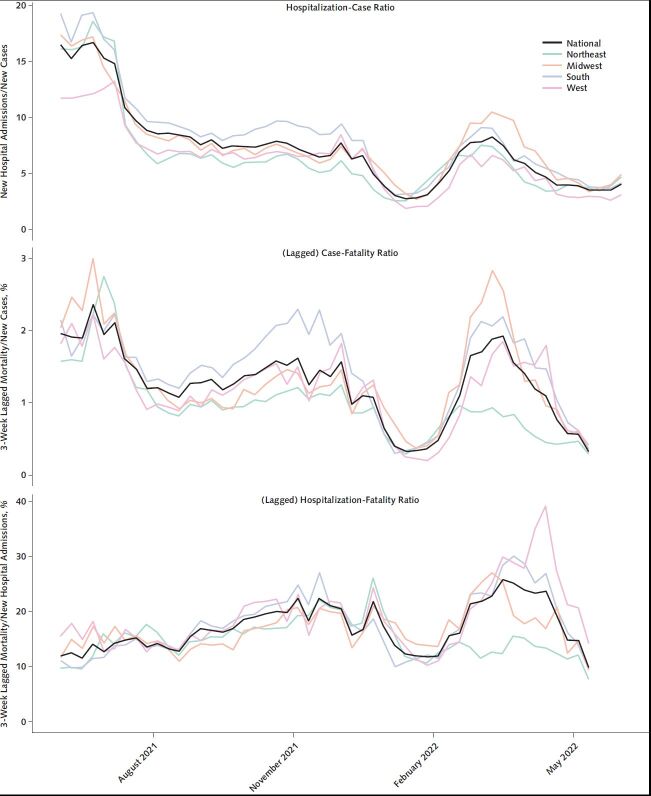
Figure 4. Coronavirus disease 2019 hospitalization-case ratio (top), case-fatality ratio (middle), and hospitalization-fatality ratio (bottom), United States and by U.S. Census region, 30 May 2021 through 4 June 2022.

Figure 4. Coronavirus disease 2019 hospitalization-case ratio (top), case-fatality ratio (middle), and hospitalization-fatality ratio (bottom), United States and by U.S. Census region, 30 May 2021 through 4 June 2022. Lines in colors represent regions, with the overall national level marked in black. In the case-fatality and hospitalization-fatality ratios, mortality is lagged by 3 weeks, and the series is truncated at 14 May to accommodate this lag.

Lines in colors represent regions, with the overall national level marked in black. In the case-fatality and hospitalization-fatality ratios, mortality is lagged by 3 weeks, and the series is truncated at 14 May to accommodate this lag.