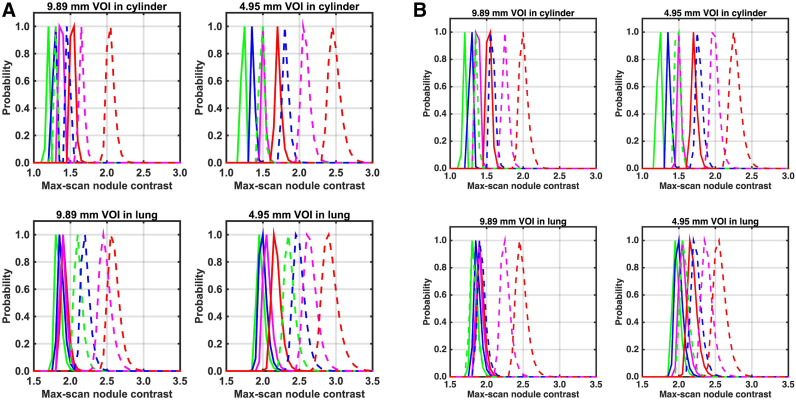
FIGURE 3.
Maximum scan distribution of noise nodule contrast calculated in lung and cylinder regions for 9.89- and 4.95-mm-diameter spheres. (A) Plots showing data from Vision with (solid lines) and without (dashed lines) postreconstruction smoothing. (B) Plots showing data from Vision (solid lines) and mCT Flow (dashed lines), both with postreconstruction smoothing. Within each group of curves, scan time from left to right is 6 min (red), 2 min (magenta), 1 min (blue), and 0.5 min (green). VOI = volume of interest.

