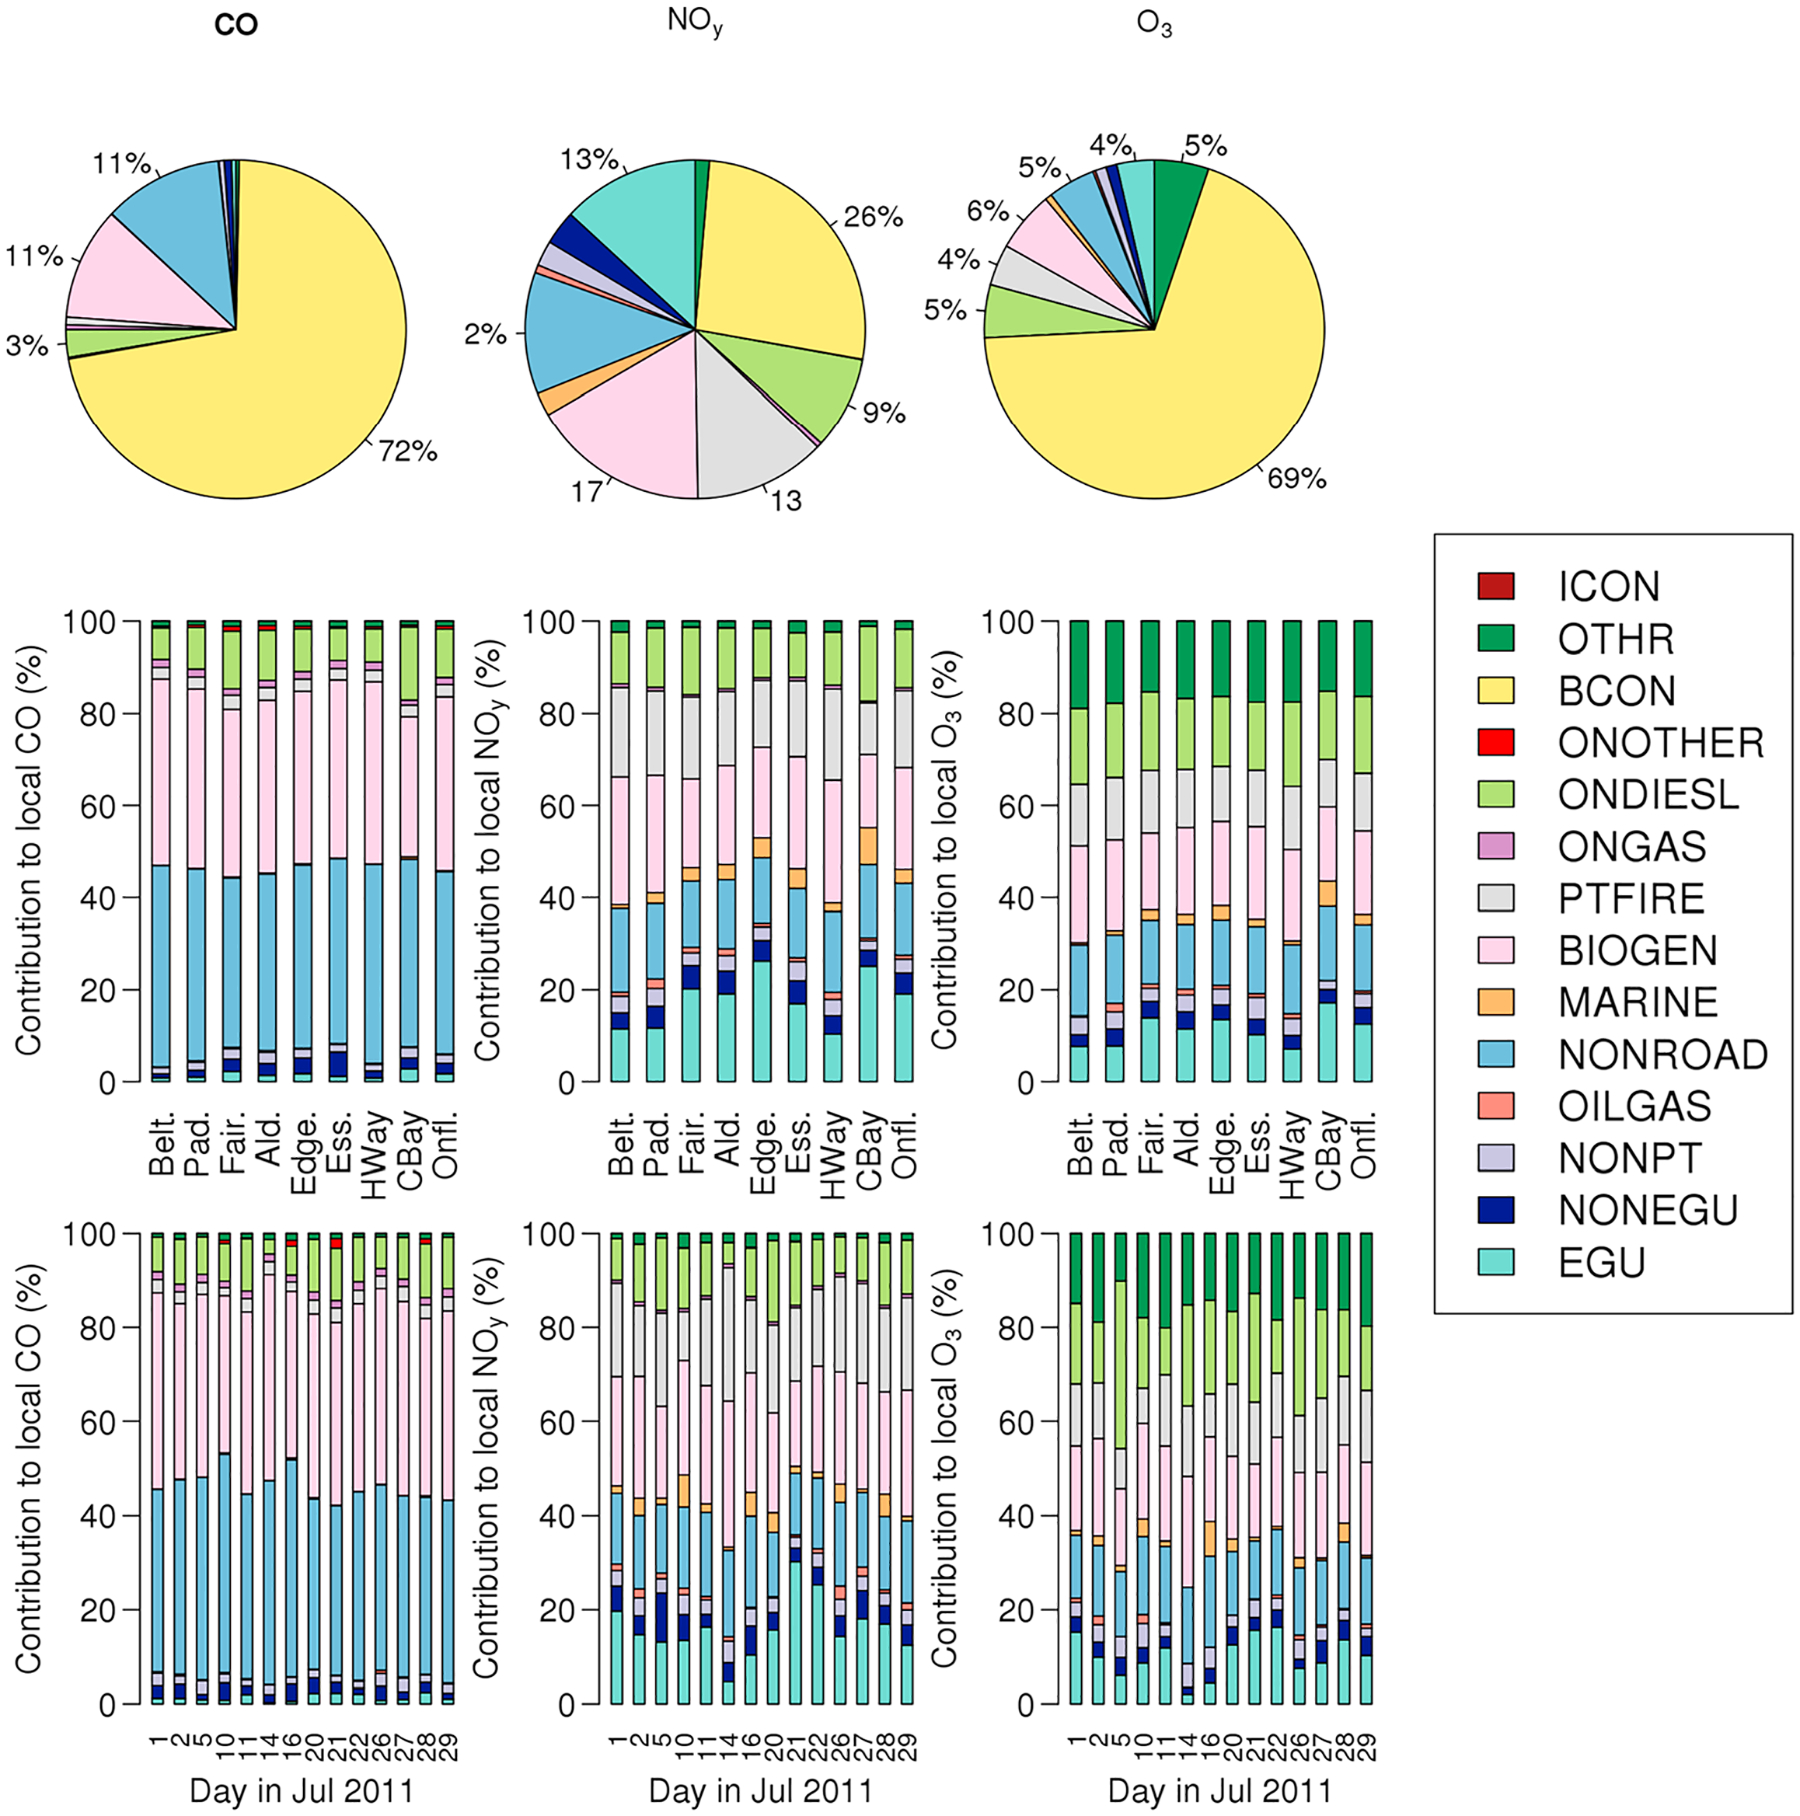
Figure 3.

Percent contribution to modeled (left) CO, (middle) NOy, and (right) O3 mixing ratios from different source categories across all locations and days (top row, pie charts). Percent contribution of modeled (left) CO, (middle) NOy, and (right) O3 local mixing ratios (i.e., excluding boundary condition influences) aggregated by location (second row, stacked bar) and by day in July (bottom row, stacked bar).
