
Figure 5.
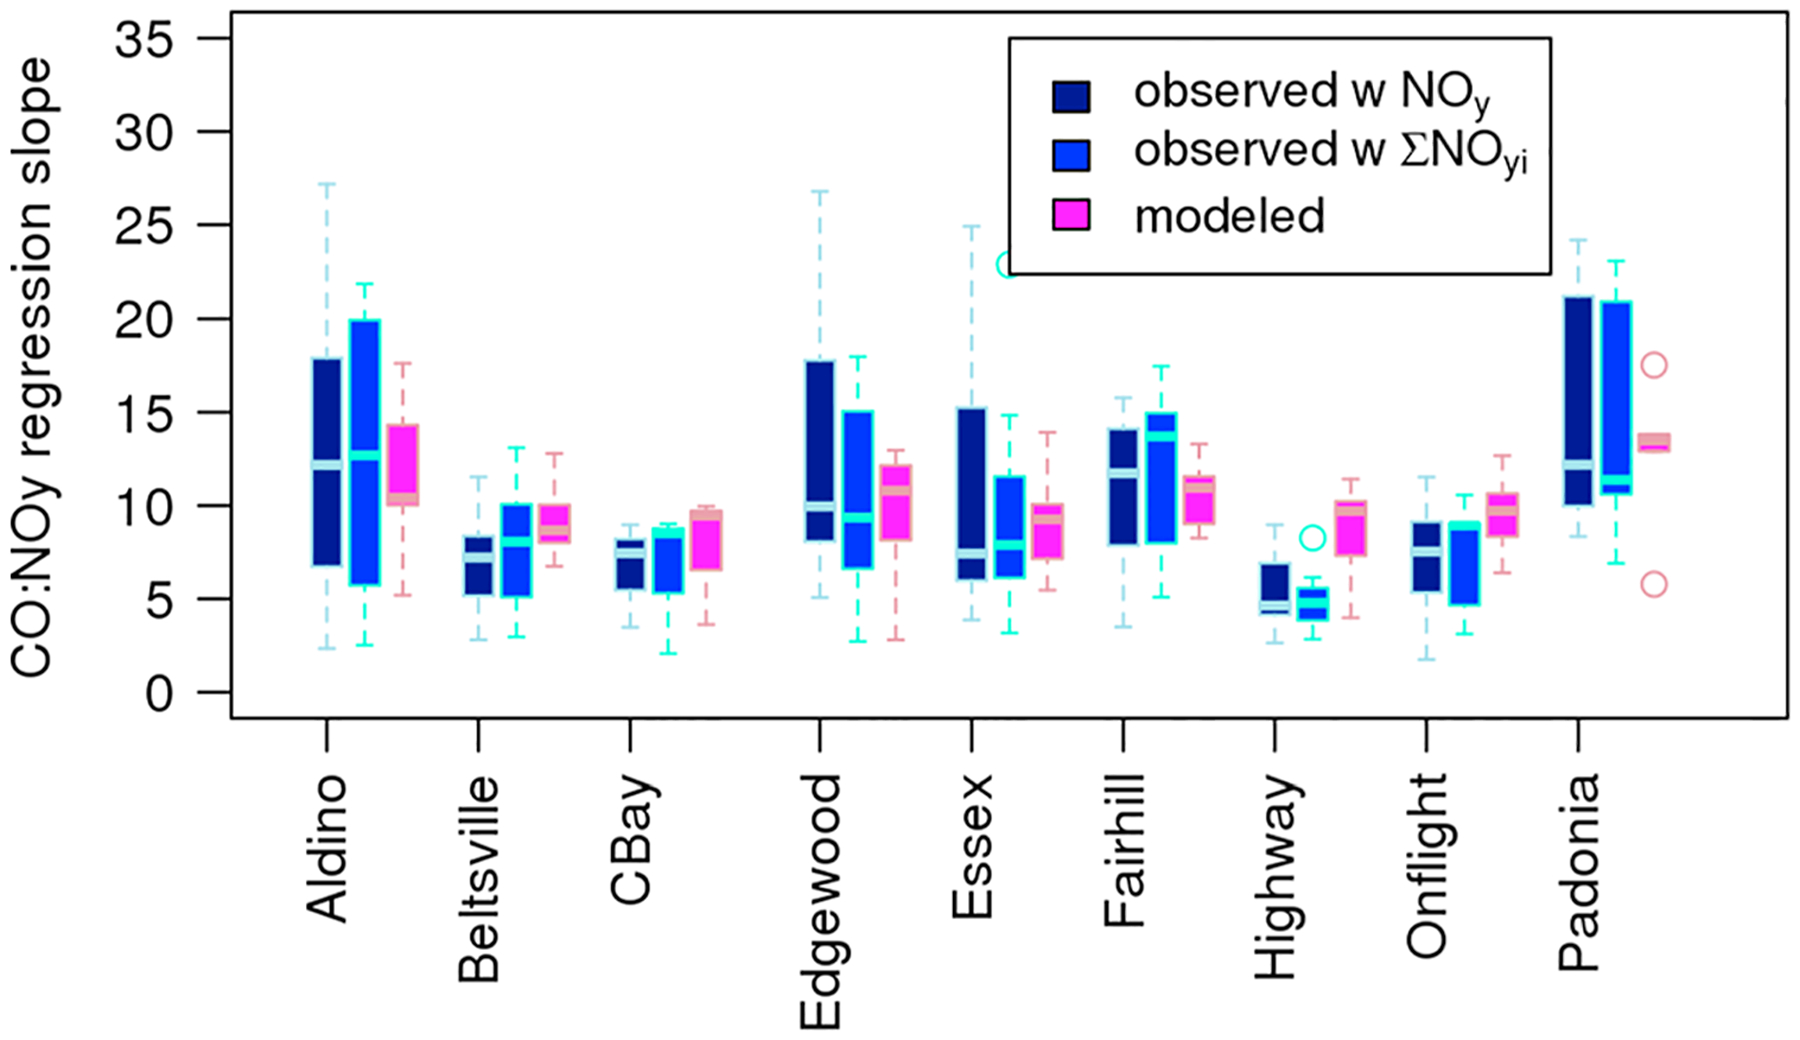
Boxplot showing range of daily ΔCO:ΔNOy regressions at each site for the subset of 65 regressions that had statistically significant slopes for all three data sets and for which the 95th percentile confidence interval for the NOy and the ∑NOy,I regression slopes overlapped. The midline shows the median value, boxes indicate the interquartile range, while whiskers extend to 1.5 times the interquartile range. Circles indicate outlier values.