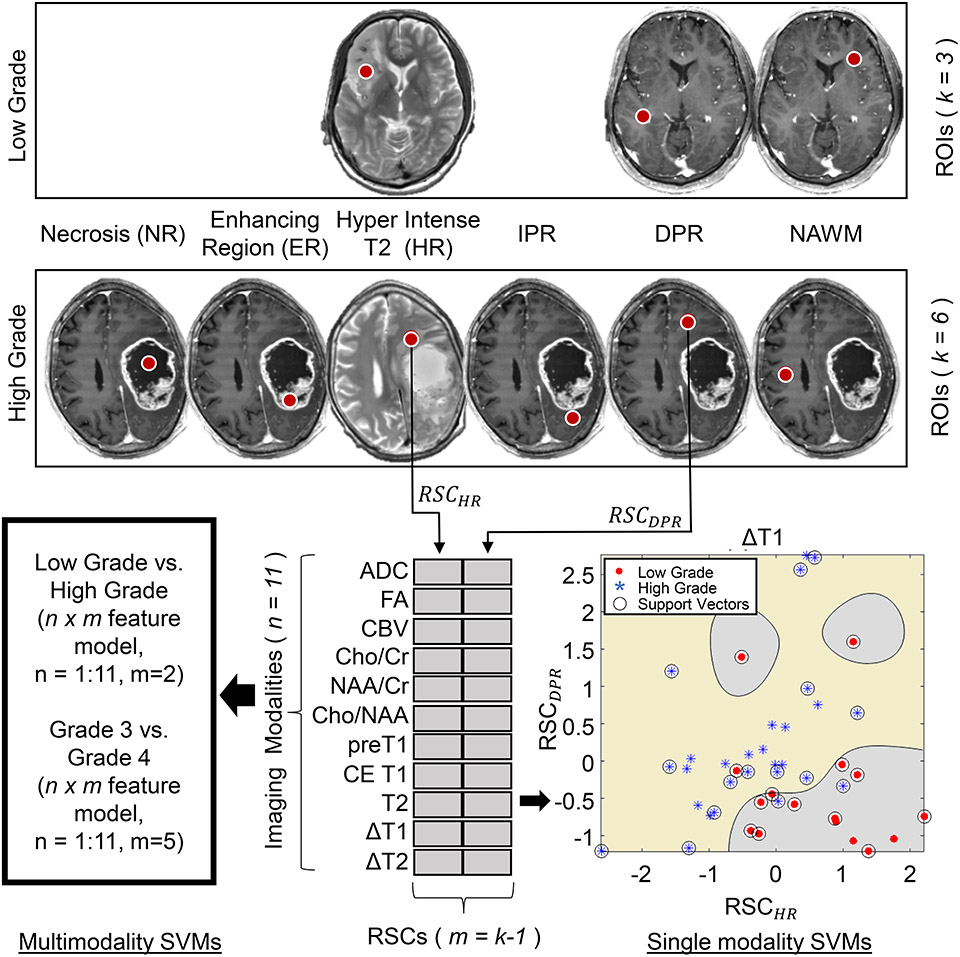
Figure 2:
Outline of the Support Vector Machine (SVM) classification methodology showing selection of regions of interests (ROIs) in Enhancing Region on CE-T1 (ER), Hyperintense T2 Region (HR), Immediate Peritumoral Region (IPR), Distal Peritumoral Region (DPR), Necrotic Region (NR), and normal appearing white matter (NAWM) in low and high-grade gliomas. Metrics are generated from 11 images/maps and single and multi-modality (combination) SVMs are executed for classification.
Abbreviations: RSC, Relative signal contrast; m, number of RSCs used in the classification model; n, number of modalities ADC, Apparent Diffusion Coefficeint; CBV, Cerebral Blood Volume; Cho, Choline; NAA, N-acetylaspartate; Cr, Creatine; FA, fractional anisotropy; CE, Contrast Enhanced; DWI, diffusion-weighted imaging; MRS, MR spectroscopy.

