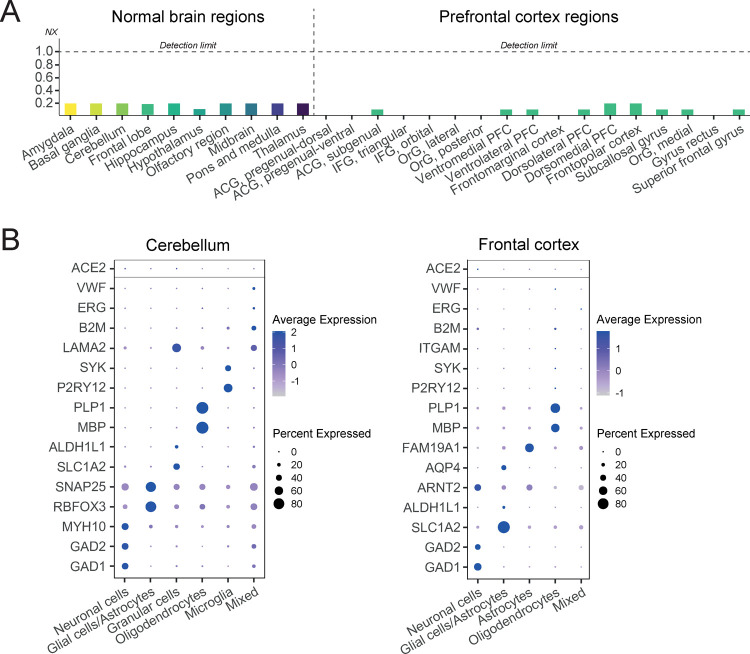
Figure 1.
Transcriptomic profiling of ACE2 in the normal brain. (A) Overview of normalized expression levels (NX) of ACE2 based on bulk RNA expression in 10 normal brain regions as well as 17 different regions of the prefrontal cortex. For all regions, expression levels were below the detection limit. ACG = anterior cingulate gyrus, IFG = inferior frontal gyrux, OrG = orbitofrontal gyrux, and PFC = prefrontal cortex. (B) Analysis of ACE2 expression in the normal cerebellum and frontal cortex based on snRNA-seq. The expression of ACE2 (top row) was compared with known marker genes representing different cell types present in these tissues. No enrichment of ACE2 expression was observed in any of the analyzed cell types.

