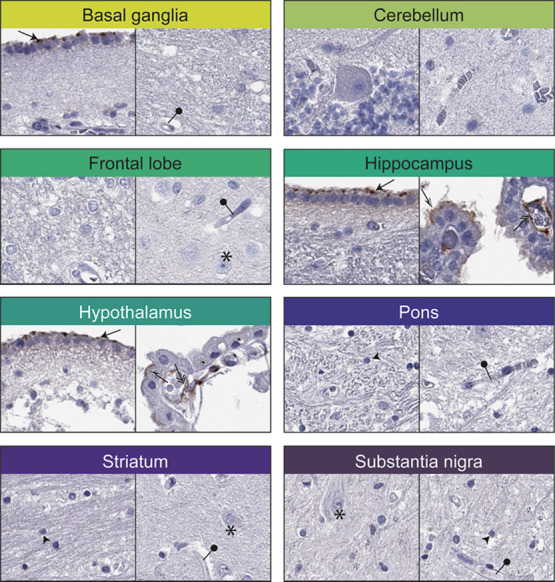
Figure 3.

Immunohistochemical staining patterns of ACE2 in normal brain samples. Two representative images for each of the eight different regions of the normal brain. Distinct positivity was observed in ependymal cells (black arrows), choroid plexus cells (black and white arrows), and endothelial cells of the choroid plexus (double arrows). All other cell types, including neuronal cells (star), glial cells (black arrowhead), and endothelial cells in other brain regions (black needle), were negative.
