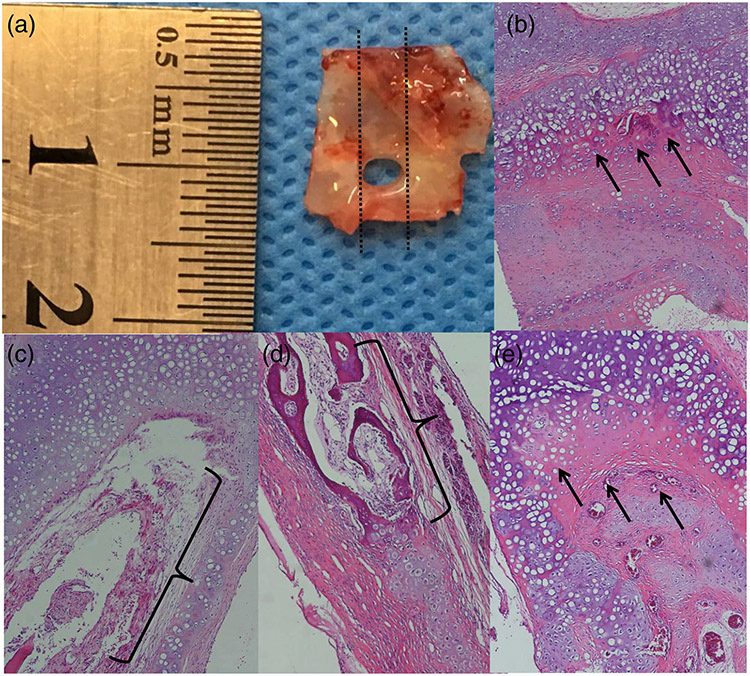
FIGURE 6.
Closest tissue to the borders of the defect; the dashed lines indicate the location of section for histological assessment (a), neocartilage formation (arrows) in an EGH scaffold specimen (b), granulation tissue formation (brackets) in an EGH plus homologous cell specimen (c), bone formation (brackets) in an EGH plus homologous cell specimen (d), and neocartilage formation (arrows) in an EGH plus autologous cell specimen (e)

