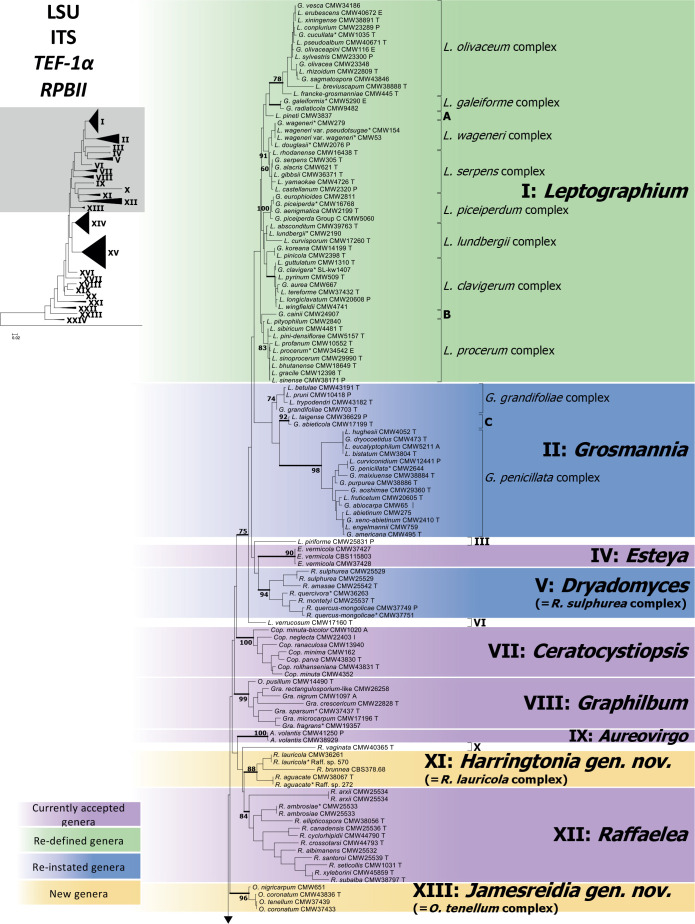
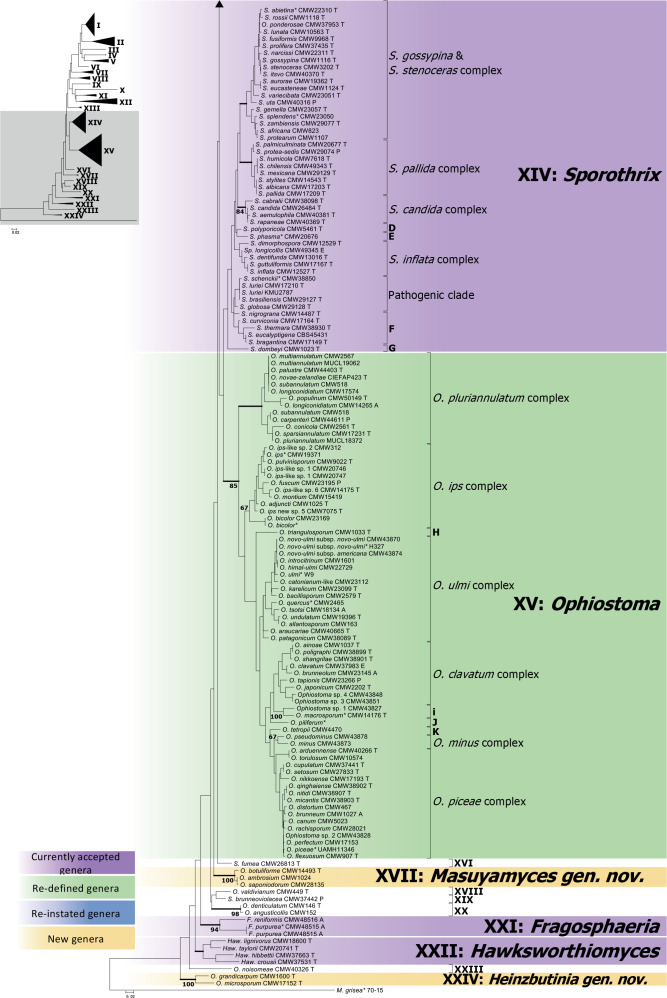
Fig. 5.
Phylogenetic tree depicting the boundaries of currently accepted genera in the Ophiostomatales. This tree was generated using maximum likelihood analysis of the concatenated dataset of LSU, ITS, TEF1-α and RPBII gene regions. The dataset consisted of 264 isolates and 2 360 characters (including gaps). Bootstrap values above 60 % are shown. Bold lines indicate Bayesian posterior probabilities values above 0.8. Bootstrap values and Bayesian posterior probabilities values below the species complex level were removed for simplification. Purple blocks indicate existing genera, yellow blocks new genera described in this study, green blocks, genera that we redefine here, and blue blocks indicate genera that that have been reinstated and re-defined. (T = ex-type, E = ex-epitype, P = ex-paratype; L = ex-lectotype; A = authentic isolate, used in the original study; * Genome sequenced).


