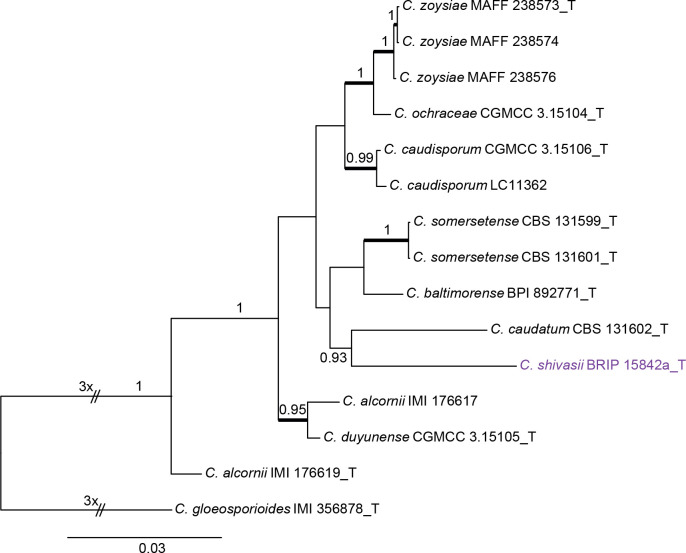
Fig. 2.
Phylogenetic tree of the C. caudatum species complex resulting from a Bayesian analysis of the combined apn2, ITS, Mat1/Apn2, and sod2 sequence alignment. Maximum likelihood bootstrap support values (> 70 %) are emphasised by thickened branches, bayesian posterior probabilities (PP > 0.90) are shown at the nodes. The scale bar represents the expected number of changes per site. Ex-type strains are indicated with “T” in the end of the taxa labels. Latin names and ex-type strain numbers of the new species described in the current study are shown in purple font.

