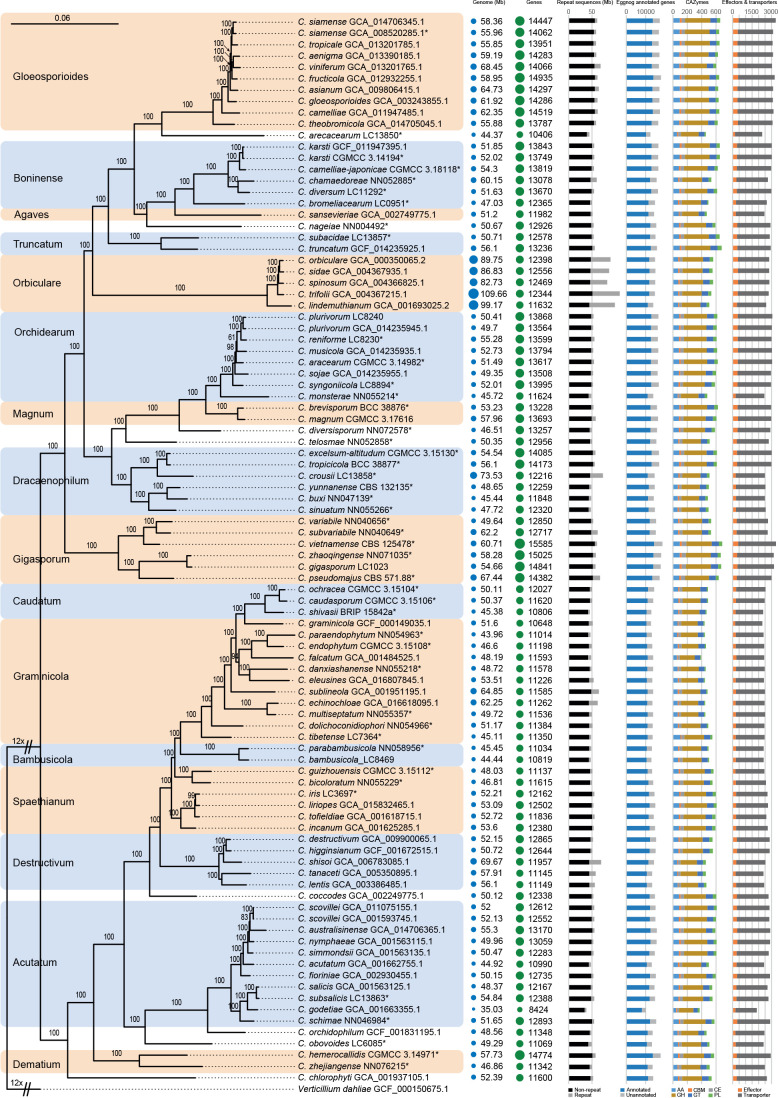
Fig. 4.
Maximum likelihood phylogenomic tree generated from a concatenated alignment of sets of orthologous protein sequences. A total of 1 893 single-copy orthologs were retained. The tree was estimated based on the JTT substitution model. Ex-type strains are indicated with “*” in the end of the taxa labels. Genome and assembly features are shown at the right side of the phylogenetic tree. From left to right: Genomes (Mb): genome size in Mb; Genes: number of predicted genes; Repeat sequences (Mb): genome sizes showing proportion of repeat elements in these genomes; Eggnog annotated genes: number of predicted protein coding genes with and without functional annotation based on eggnog database; CAZymes: gene number with the distribution of CAZyme classes, auxiliary activities (AA), carbohydrate binding molecules (CBM), carbohydrate esterases (CE), glycoside hydrolases (GH), glycosyl transferases (GT), polysaccharide lyases (PL); Effectors & transporters: number of predicted effectors and transporters.

