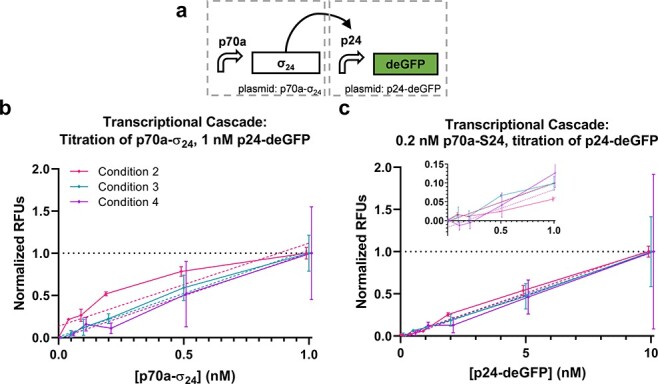
Figure 2.

Transcriptional cascade. (a) Transcriptional cascade circuit and corresponding normalized performance data titrating (b) the S24 expression plasmid and (c) reporter plasmid. Data are normalized between the 0 and 1 nM points for p70-σ24 (b) and 0 and 10 nM points for p24a-degfp (c). Data points from each condition are presented slightly offset on the x-axis to improve plot visibility. Error bars indicate one standard deviation; n = 3 for Condition 2, n = 2 for Condition 3 and n = 2 for Condition 4. Solid lines are direct connections between data points. Dashed lines indicate linear fits of corresponding data as indicated by matching color. (c) includes an inset showing lower plasmid concentrations.
