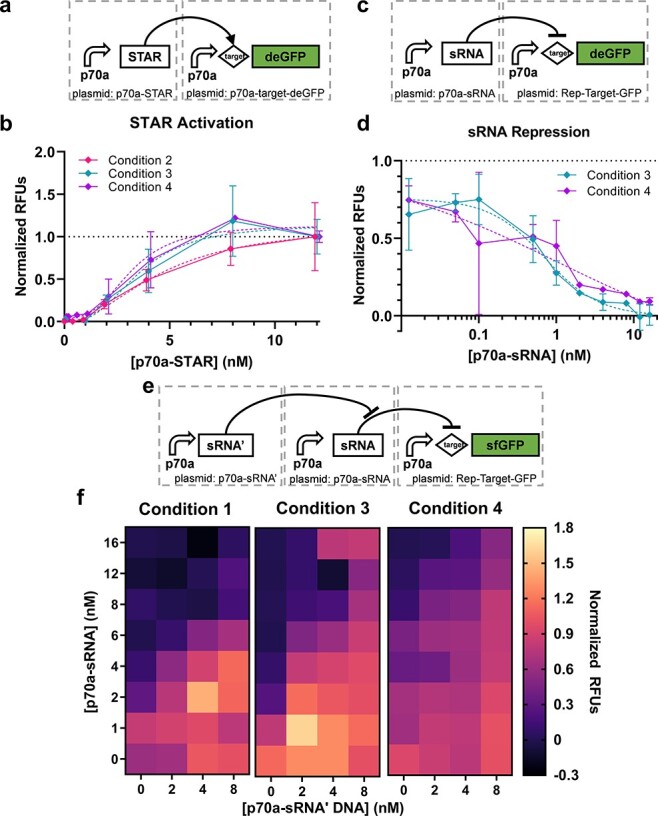
Figure 3.

RNA regulation circuits. (a) The STAR activation circuit and (b) corresponding performance data (n = 2 or 3); data are normalized between 0 and 1 by the 0 and 16 nM cases, respectively. Error bars indicate one standard deviation. Dashed lines indicate sigmoid fits of corresponding data as indicated by matching color. (c) The sRNA repression circuit (n = 2) and (d) corresponding performance data; data are normalized between 0 and 1 by the 12 and 0 nM cases, respectively. Error bars indicate one standard deviation. Dashed lines indicate sigmoid fits of corresponding data as indicated by matching color. (e) The sRNA sequester circuit and (f) corresponding performance data (n = 3, 1 or 3 for Conditions 1, 3 and 4, respectively); data are normalized between 0 and 1 by the 16 nM p70a-sRNA + 0 nM p70a-sRNA’ and 0 nM p70a-sRNA + 8 nM p70a-sRNA’ cases, respectively.
