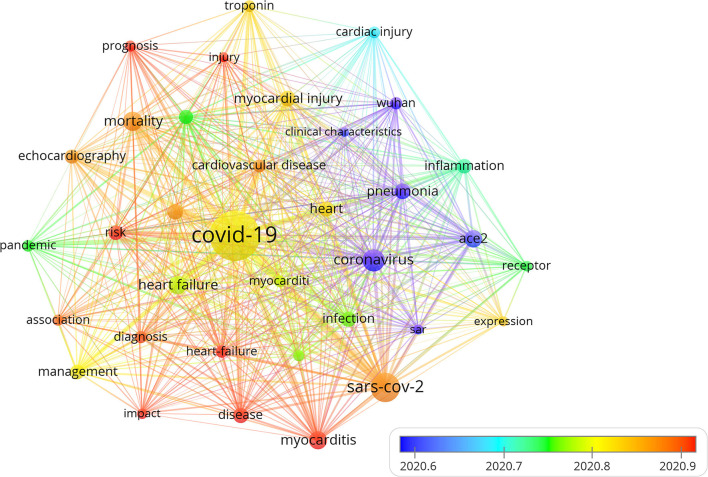
Figure 8.
The timeline visualization map of keywords clustering analysis on cardiac involvement in COVID-19. Different colors represented different years. The warmer the color was, the closer the year. This figure displayed a timeline chart of COVID-19-mediated cardiac involvement based on VOSviewer software. The figure visually reflected the phased hotspots and epidemic status of severe COVID-19 from the time dimension. The initial research mainly focused on pneumonia caused by coronavirus through the receptor of ACE2 in Wuhan. With the spread of the disease, it was found that severe pneumonia infection with an obvious inflammatory response mediated by SARS-CoV-2 can lead to cardiac injury. With the global pandemic of COVID-19, the keywords referring to myocadiac injury, including HF, myocarditis, and troponin had become increasingly prominent. With the deepening understanding of the disease, further identification of HF and myocarditis through echocardiography was of great significance for the prognosis in severe COVID-19 patients.

