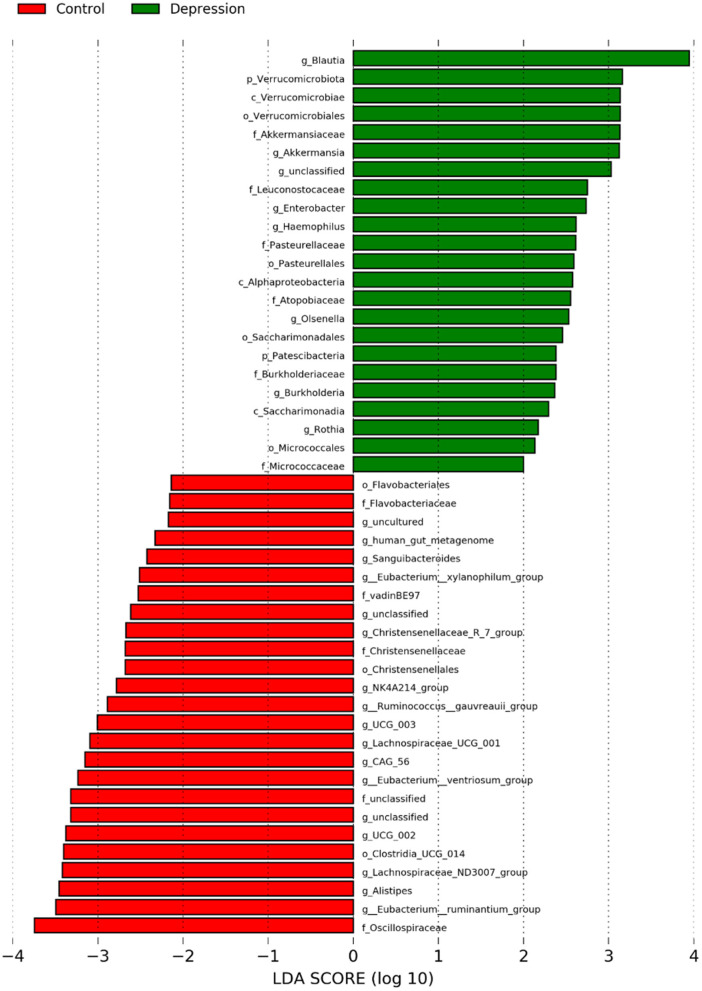
Figure 4.
Abundances of bacterial taxa at the genus level in the late-life depression (LLD) patient and healthy control groups, as determined with the linear discriminant analysis (LDA) effect size (LEfSe) method. The taxonomic cladogram was generated based on the LEfSe and LDA scores. LLD-enriched taxa are indicated with a positive LDA score (green), and taxa enriched in controls have a negative score (red). Only taxa meeting the LDA significance threshold >2 are shown.

