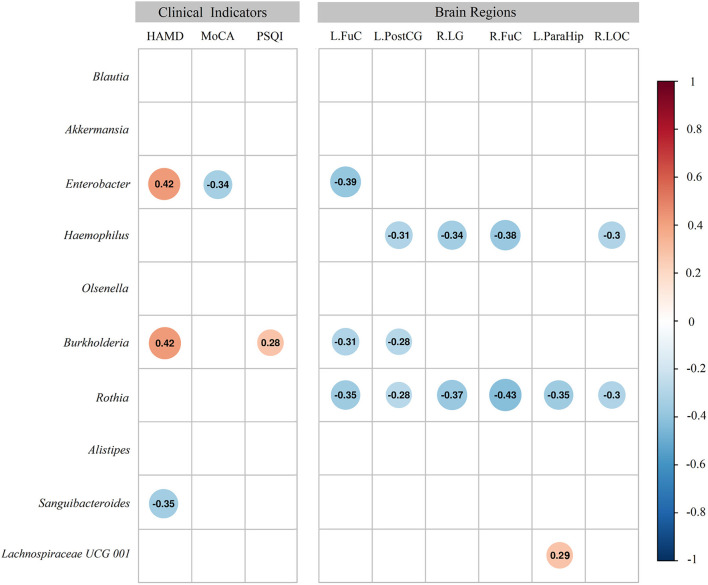
Figure 5.
Heatmap of Spearman's rank correlation coefficients of the relative abundances of different gut microbiota at the genus level with clinical indices and regions with brain morphometric differences. Color intensity represents the magnitude of the correlation (blue circles = negative correlations; red circles = positive correlations).

