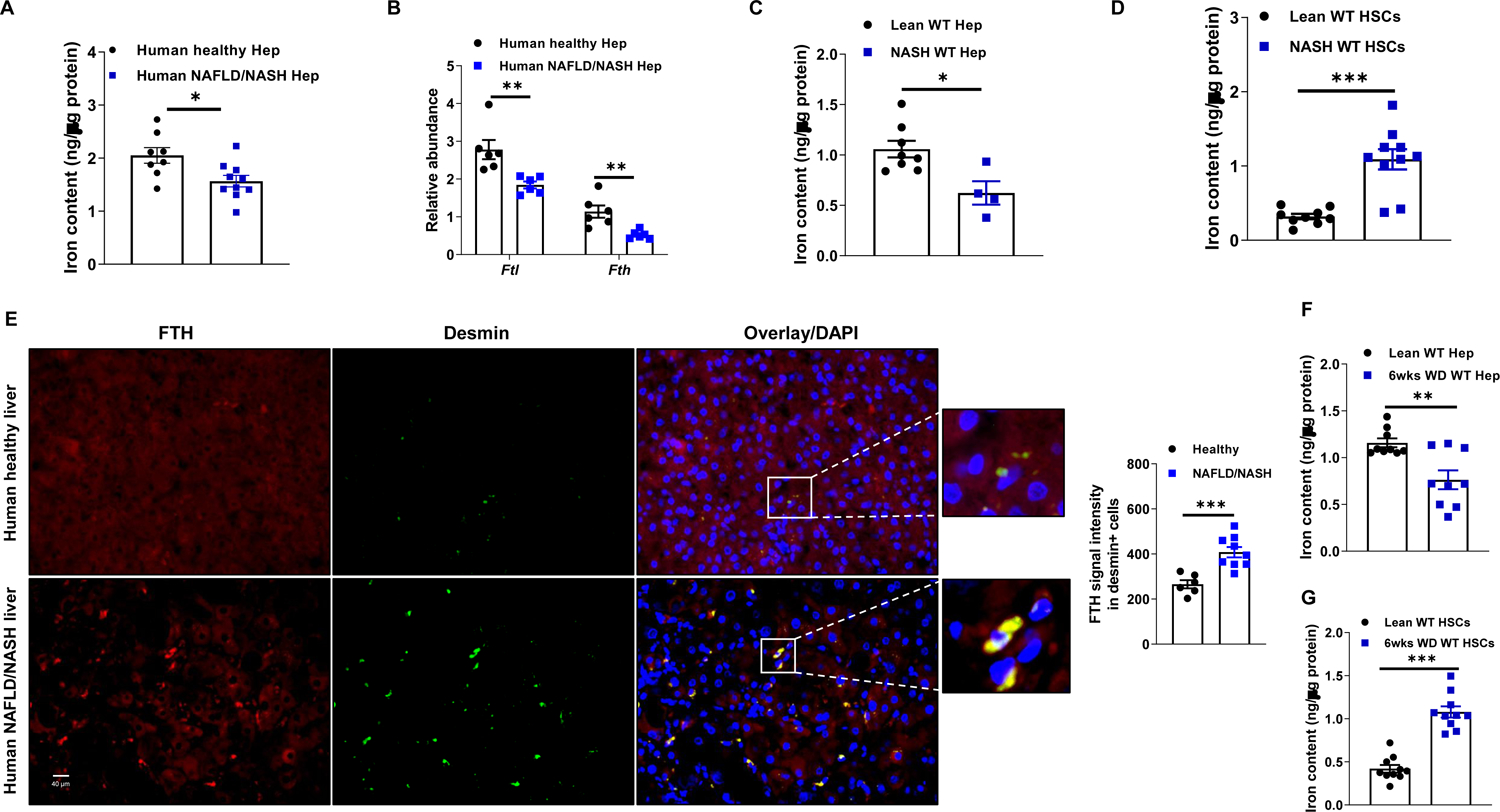
Figure 1. NAFLD/NASH is characterized by abnormal iron distribution in hepatic cells.

(A) Total iron content in human hepatocytes (Hep) of lean/healthy or NAFLD/NASH individuals.
(B) The abundance of ferritin in human healthy/lean vs. NAFLD/NASH hepatocytes.
Total iron levels in hepatocytes (C) and HSCs (D) of lean and 24 weeks Western diet-fed (24wks WD) NASH WT mice.
(E) Immunofluorescence staining of human liver sections of lean/healthy and NAFLD/NASH individuals to examine the abundance of FTH in Desmin+ HSCs. Total iron levels in hepatocytes (F) and HSCs (G) in WT mice after 6wks WD feeding.
Data are presented as mean ± SEM. *P < 0.05, **P < 0.01, ***P < 0.001, Student’s t-test. See also Figure S1.
