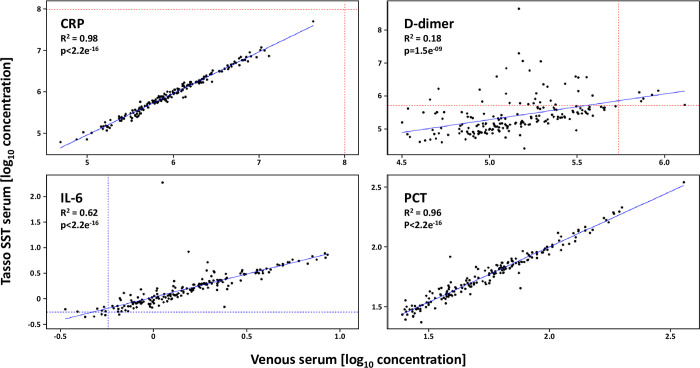
Fig 2. Correlation of selected protein concentrations in matched peripheral blood samples of 42 TAMC healthy controls obtained in-clinic using the Tasso SST (capillary serum) and phlebotomy (venous serum).
Up to 5 samples were collected from each participant over a 28-day period and are aggregated here. Concentrations were log10 transformed. Scatter plots were fitted with a simple linear regression (solid blue line), and the Pearson correlation R and p values are shown. Ella assay limits of detection are show with the dashed lines (blue: LLoD; red: ULoD).

