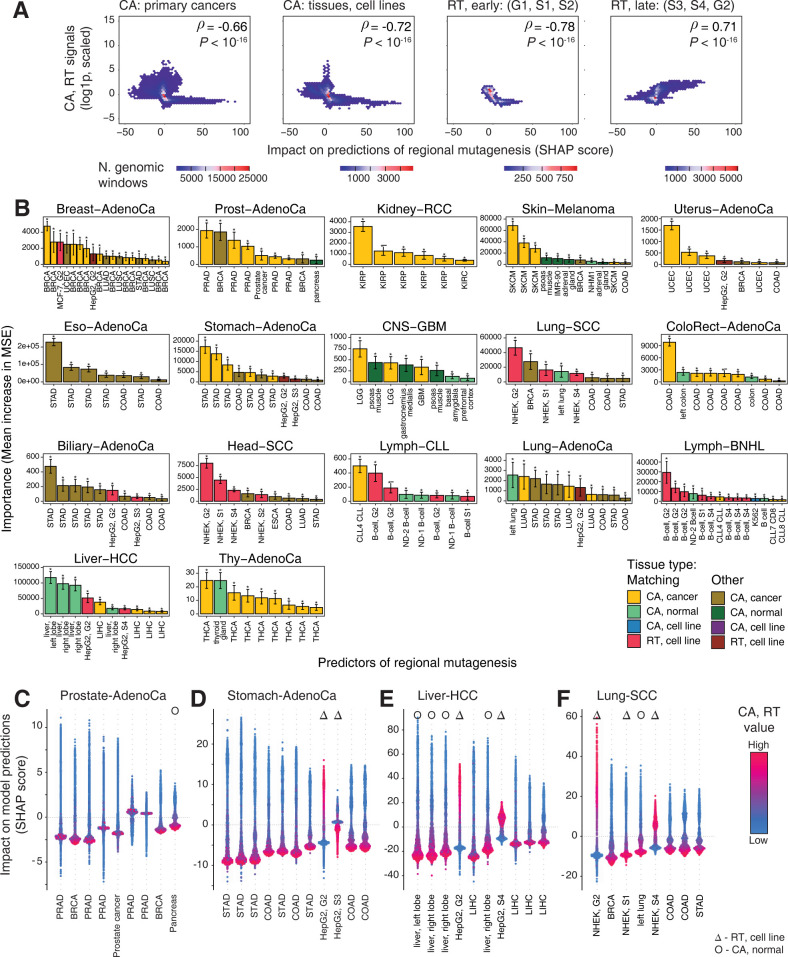
Fig 3. Top predictors of regional mutagenesis tie cancer types and sites of origin.
A. 2D-density plots show the association CA and RT scores (Y-axis) and Shapley feature importance (SHAP) scores in each genomic window (X-axis) across all cancer types for significant predictors (permutation P < 0.001). CA profiles for cancer and normal samples, early RT profiles, and late RT profiles are plotted separately. CA and early RT profiles negatively correlate with regional mutation burden while late RT profiles correlate positively. Spearman correlation values are shown (top right). B. CA profiles of primary cancers are the top predictors of regional mutagenesis in most cancer types. Bar plot shows the importance scores of the significant predictors of random forest models for 17 cancer types (permutation P < 0.001). Error bars show ±1 standard deviation (s.d.) from bootstrap analysis. Brighter colors indicate the predictors where the epigenomic profile (CA or RT) matches the mutation profile of the related cancer type. C-F. Shapley additive explanation (SHAP) scores of significant predictors. SHAP scores show the impact of a given predictor on the predictions of regional mutation burden (Y-axis) relative to the values of the predictor (CA or RT; color gradient). In CA profiles, higher CA values (purple) and negative SHAP scores show decreased mutation burden in open chromatin. In late RT profiles, higher RT values and positive SHAP scores show increased mutation burden. Symbols indicate RT profiles (triangles) and CA profiles of normal tissues (circles). SHAP scores for all significant predictors are shown in S6 Fig. Duplicated labels of in panels B-F indicate the CA profiles of different cancer samples in the TCGA dataset (S1 Table).

