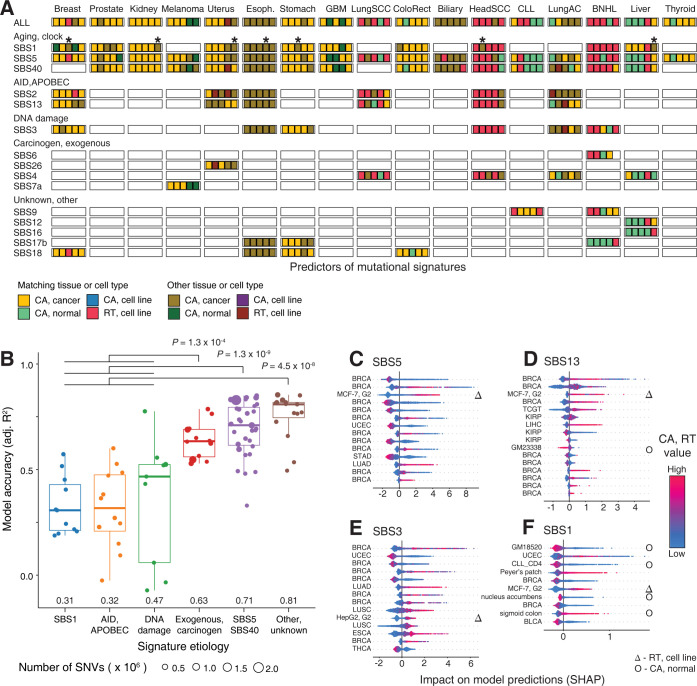
Fig 4. Associations of mutational signatures with chromatin accessibility and replication timing.
A. Top predictors of megabase-scale mutation burden of single base substitution (SBS) signatures (top five predictors; P < 0.001, permutation test). Colors indicate the predictor type (CA, RT) and its relationship to the cancer type where mutagenesis is predicted (matching site/tissue or other). Brighter colors indicate the predictors where the epigenomic profile (CA or RT) matches the cancer type of the mutation profile. Asterisks indicate CA profiles of CD4-positive T-cells as predictors of SBS1 mutations. All significant predictors are shown in S7B Fig. Prediction accuracy of megabase-scale burden of SBS signatures using CA and RT profiles. Signatures of carcinogens, unknown origin, and aging are more accurately predicted by CA and RT profiles than endogenous signatures. P-values are computed using F-tests with adjustment for genome-wide signature burden. Median accuracy values are printed. C-F. SHAP scores of significant predictors of selected mutational signatures in breast cancer. SHAP scores show the impact of the predictor (i.e., CA or RT profile) on the predictions of SBS burden (X-axis) and the corresponding predictor values (color gradient). Symbols indicate RT profiles (triangles) and CA profiles of normal tissues (circles). SHAP scores for all significant SBS predictors for breast cancer are shown in S8 Fig.

