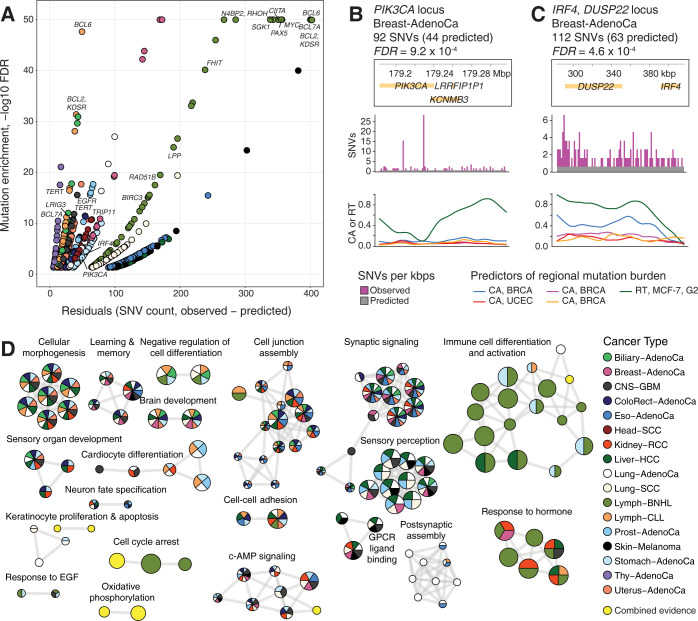
Fig 5. Genomic regions with overrepresented mutations converge to cancer genes and developmental pathways.
A. Genomic regions (100-kbps) with overrepresented mutations that significantly exceeded the predictions of models informed by CA and RT profiles. Regions with significantly higher model residuals are shown (FDR < 0.05). Significant regions with known cancer genes are labeled (FDR < 10−10). Colors indicate the cancer types where the overrepresented mutations were found (see panel D). X-axis is capped at 50 and Y-axis is capped at 400. B-C. Examples of genomic regions with overrepresented mutations and known or putative cancer driver mutations. The plots show the genes in the region (top), observed and expected mutation burden (SNVs per kbps; middle), and the top five most significant predictors in our models (i.e., CA and RT profiles; bottom). B. The genomic region encoding the driver gene PIK3CA in breast cancer. C. Super-enhancer region at the IRF4-DUSP22 locus with overrepresented mutations in breast cancer. D. Pathway enrichment analysis of the genomic regions where the mutations were overrepresented compared to CA- and RT-informed predictions. The enrichment map visualisation shows significantly enriched biological processes and pathways (FDR < 0.05). Nodes in the network represent enriched pathways and processes, the edges connect nodes sharing many genes, and the manually annotated sub-networks represent functionally related pathways and processes. Colors show the cancer types where the pathway enrichments were detected. The pathways and processes that were only detected in the joint analysis of multiple cancer types are shown in yellow.

