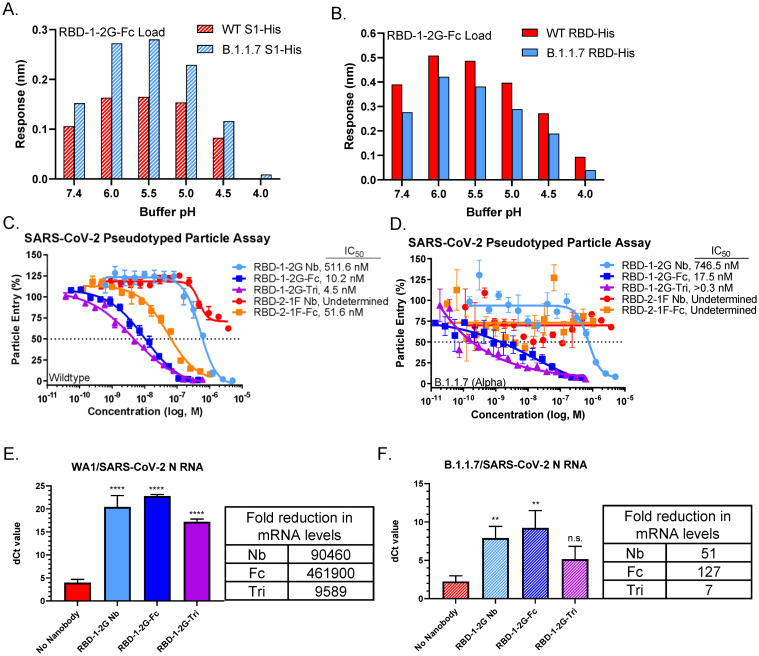
Fig 4. Binding and neutralization of RBD-1-2G to the WT and B.1.1.7 variant (N501Y).
(A) Maximum response values reached during the association phase by RBD-1-2G-Fc binding wildtype (WT) and B.1.1.7 (Alpha) variant S1-His. Differences in pH were achieved using PBS (pH 7.4) or 10 mM Acetate buffers with 150 mM NaCl (pH 4 –pH 6.0), all buffers contained 0.1% BSA and 0.02% Tween. (B) Maximum response values reached during the association phase by RBD-1-2G-Fc binding WT and UK variant RBD-His proteins. (C-D) SARS-CoV-2 pseudotyped particle entry assay using HEK293-ACE2 cells as target. Inhibition of WT(C), B.1.1.7 (D) pseudotyped particle treated with various RBD-1-2G and RBD-2-1F formats. Representative biological replicate with n = 2. Technical replicates are n = 3 per concentration, all error bars represent S.D. (E-F) Primary human airway air liquid interface (ALI) model of SARS-CoV-2 infection. Treatment was added at 10,000 nM for nanobody treatment and 1,000 nM for Fc and trimer modalities. Levels of SARS-CoV-2 N mRNA following infection with WA1 (E) or B.1.1.7 (F) SARS-CoV-2 viral infection was determined by qRT-PCR and normalized to 18S mRNA levels. Bars represent that average dCt from biological triplicates, errors bars represent S.D. Fold reduction in mRNA levels are compared to the no nanobody infection control. One-way ANOVA was used to compared treatment groups with the no nanobody control. Significant p values are represented as follows: **p < 0.01, ****p < 0.0001, n.s. p > 0.05.

