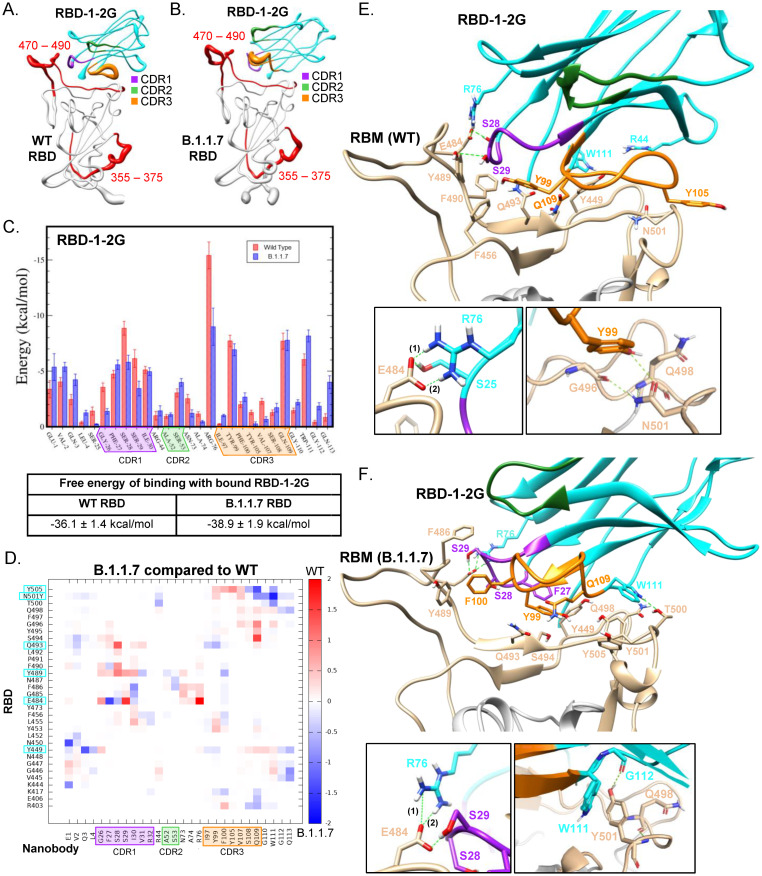
Fig 5. Molecular dynamics of RBD-1-2G with Wild type and B.1.1.7 RBD variant.
(A-B) Sausage plot representation of RBD-1-2G in complex with (A)WT RBD and (B) B.1.1.7 RBD. The most flexible regions are indicated in red. (C) Free Energy of binding contribution of each Nb residue in complex with the RBD WT and B.1.17 variant. (D) Heatmap comparing RBD-1-2G’s free energy of binding contributions against the B.1.1.7 and WT RBD. RBD residues that contributed greater than -5 kcal/mol are highlighted with cyan. (E-F) Atomic model obtained after the atomic model fitting and MD simulations of RBD-1-2G in complex with (E) WT RBD and (F) B.1.1.7 RBD.

