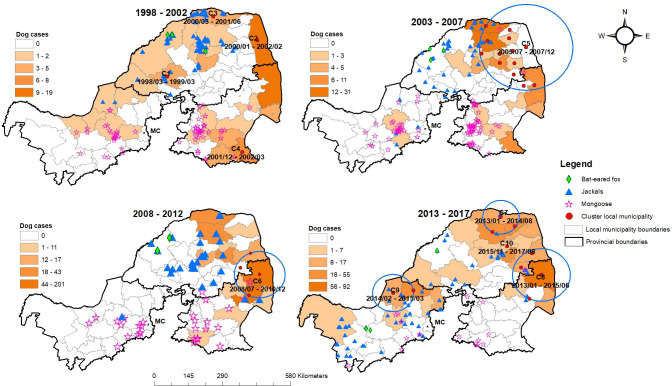
Fig 5. Spatio-temporal clusters of dog rabies in each time period and spatial distributions of wildlife rabies cases indicated on choropleth maps of dog rabies in four time periods between 1998 and 2017.
Red dots indicate local municipalities affected by spatio-temporal clusters. MC denotes a local municipality of Gauteng Province, and was excluded from this study. < https://dataportal-mdb-sa.opendata.arcgis.com/>.

