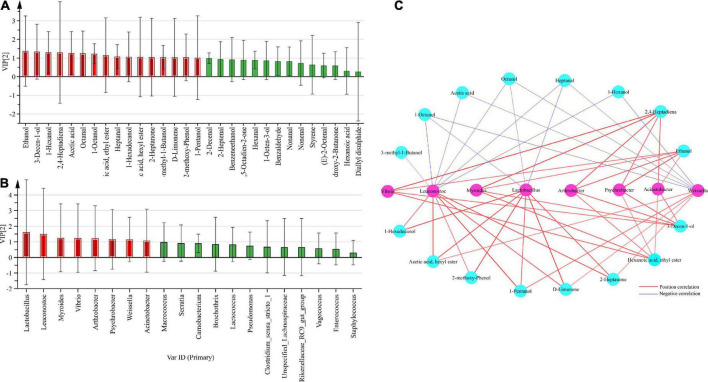
FIGURE 6.
Analysis of the core microbes and volatile compounds by O2PLS modeling. (A) VIP (variable importance for predictive components) plot of bacteria vs. the top 30 volatile compounds. (B) VIP plot of volatile compounds vs. the top 20 bacteria. (C) Correlation analyses of core bacteria and volatile compounds.

