
Figure 3. Time-of-day does not affect time spent wild running and in respiratory arrest.
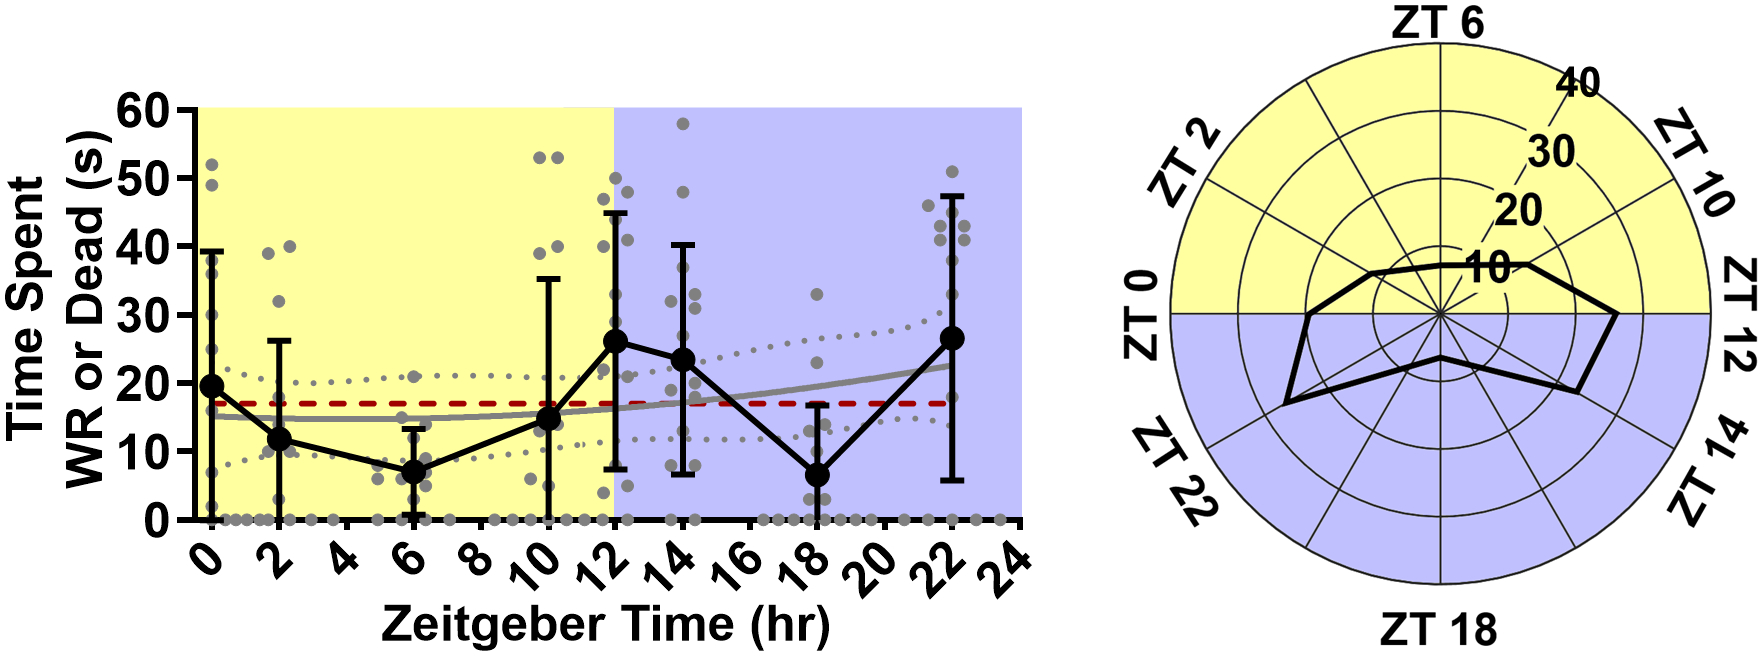
Line graph (left) and rose plot (right) depicting time spent wild running and in respiratory arrest. plotted as mean with standard deviation (black line), with individual values (grey circles, n = 15 per time point). The cosinor line of best fit is depicted as a gray curve with 95% confidence intervals (dotted gray curves). The midline estimating statistic of rhythm (MESOR) is illustrated with a dashed red line.