
Figure 6. Circadian phase does not affect first apnea duration or total apnea duration following MES seizures.
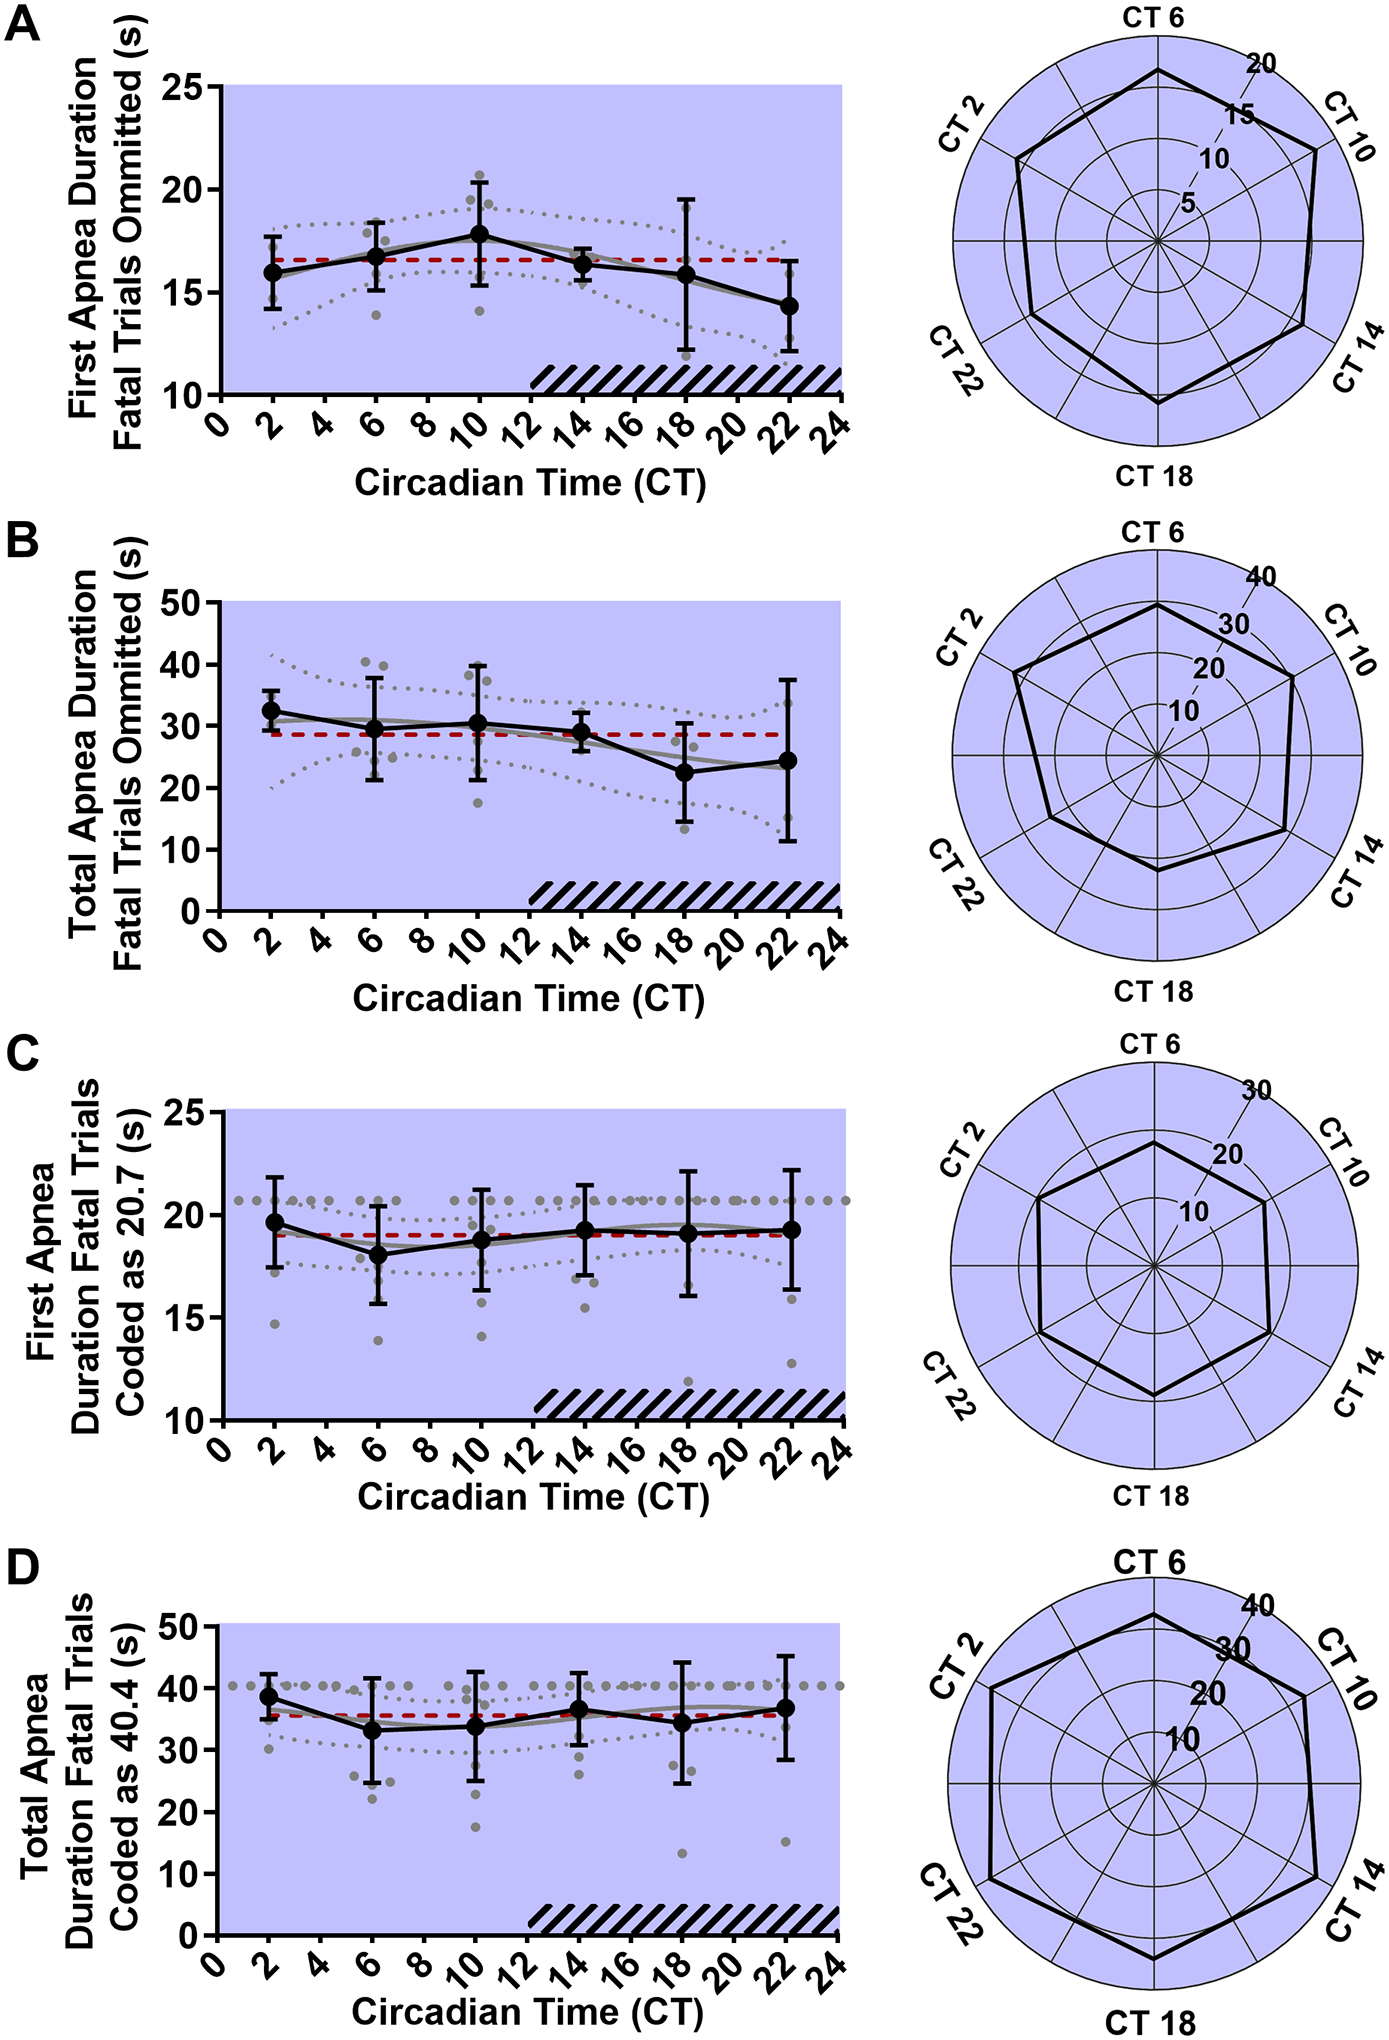
Line graph (left) and rose plot (right) depicting first apnea duration of surviving animals (A, n = 2–6 per time point). Line graph (left) and rose plot (right) depicting total apnea duration of surviving animals (B, n = 2–6 per time point). Line graph (left) and rose plot (right) depicting first apnea duration of all animals. Fatal seizures have been coded as having a first apnea duration equal to largest of surviving animals of (20.7 s, C, n = 9 per time point). Line graph (left) and rose plot (right) depicting total apnea duration of all animals. Fatal seizures have been coded as having a total apnea duration equal to largest of surviving animals of (40.4 s, D, n = 9 per time point). Values are plotted as mean with standard deviation (black line), with individual values for continuous variables (grey circles). The cosinor line of best fit is depicted as a gray curve with 95% confidence intervals (dotted gray curves). The midline estimating statistic of rhythm (MESOR) is illustrated with a dashed red line. Time points during the subjective night are indicated with diagonal hash-marks.