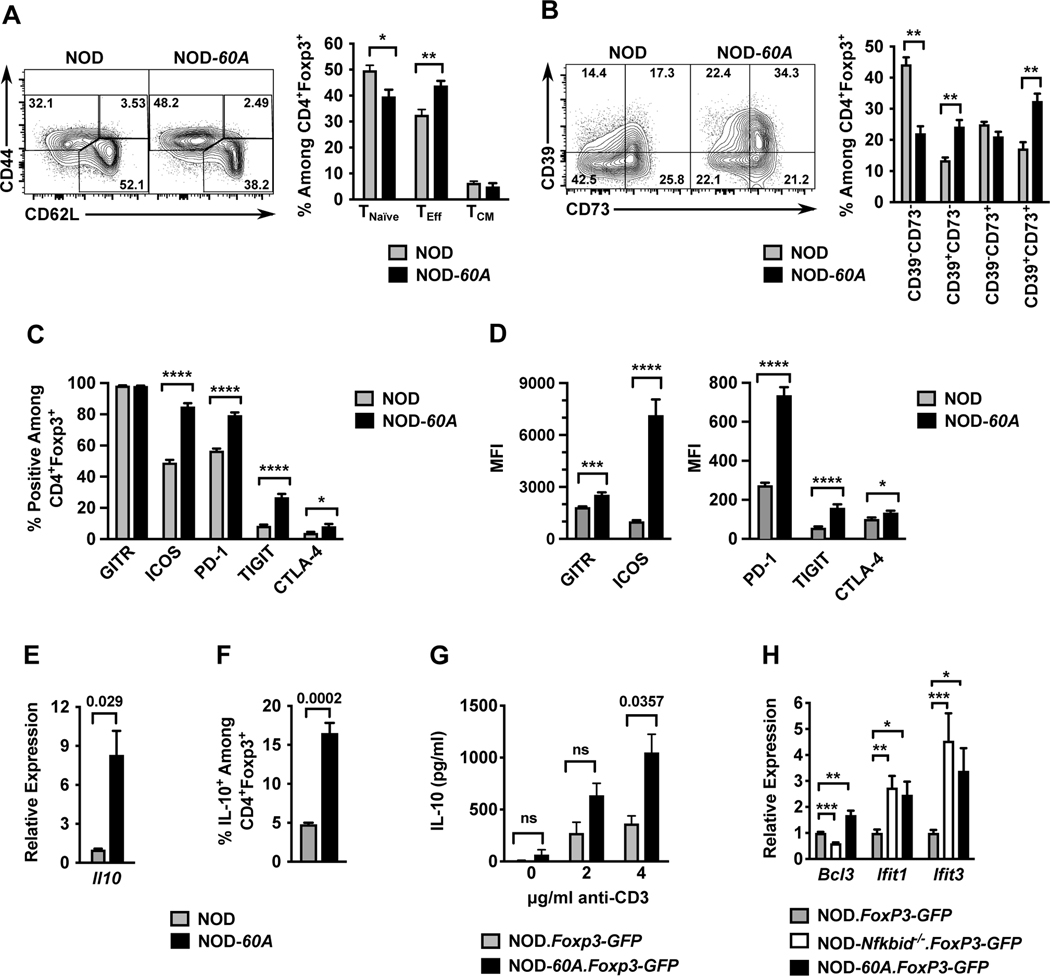
Figure 4. Nfkbid overexpression imparts an activated cellular profile to Tregs.
Splenocytes from 6–8-week-old female standard NOD and NOD-60A mice were analyzed by multicolor flow cytometry for expression of markers of activation among CD4+Foxp3+ Tregs. (A) CD44 and CD62L staining was performed on CD4+ Foxp3+ Tregs to characterize activation profile by delineating CD44loCD62L+ naïve T-cells (TNaïve), CD44hiCD62L+ (TCM) and CD44hiCD62L− (TEff) populations. n=6–7 per group. Gating (left) and quantification (right). (B) Splenocytes were stained for CD39 and CD73 expression. Gating (left) and frequency (right) of CD39 CD73 double negative, single positive and DP populations among CD4+Foxp3+ cells are shown. n=6–7 per group. (C, D) Splenocytes (n=10 per group) were stained for GITR, ICOS, PD-1, TIGIT and CTLA-4. Frequencies of CD4+ Foxp3+ Tregs showing positive staining are shown (C) with median fluorescence intensities (MFI) (D) for these stains. (E) Il10 mRNA levels were measured by qPCR of RNA isolated from sorted CD4+CD25+ splenic Tregs and normalized to Gapdh (n=4 biological replicates per group). (F). Frequency of IL-10+ cells among CD4+Foxp3+ Tregs measured from splenocyte cultures stimulated for 5 hours with cell stimulation cocktail and monensin. (G). IL-10 secretion was measured by ELISA in culture supernatants of sorted CD4+Foxp3+ Tregs stimulated with varied amounts of anti-CD3 for 3 days (n=3–5 per strain). (H) Relative expression of Bcl3, Ifit1, and Ifit3 RNA transcripts in splenic CD4+ Foxp3-GFP+ Tregs from NOD-Nfkbid−/−.Foxp3-GFP and NOD-60A.Foxp3-GFP mice compared to those from NOD.Foxp3-GFP controls (n= 6–8 per strain). All P-values were determined by Mann-Whitney nonparametric comparison (*=p< 0.05; **=p< 0.01; ***=p< 001; ****=p< 0001).

