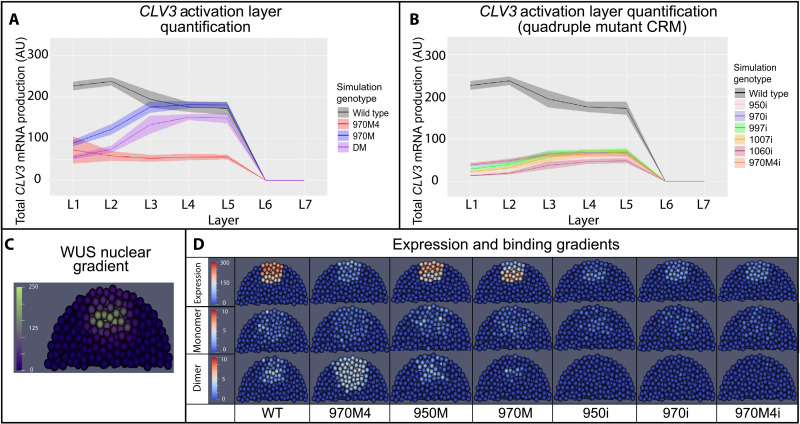
Fig. 8. Simulated CLV3 dynamics and WUS protein complexes in the 3D SAM model.
(A) Levels of CLV3 (mean = line, SD = shaded area) activation in WT system and system with selected mutated cis-elements. (B) Levels of CLV3 gene activation (mean = line, SD = shaded area) in WT system and system carrying all possible combinations of quadruple mutants (reflects intrinsic behavior of each functional cis-element). Line indicates mean CLV3 in different cell layers. Shaded area indicates SD of activation among the cells in a given cell layer. L1 to L7 indicate the layers of the SAM from outermost CZ to inner layers of the RM. (C) Spatial distribution of nuclear-localized WUS. (D) Median longitudinal sections of simulated SAMs showing WUS monomer (middle), WUS dimer (bottom), and CLV3 expression (top) in WT and system carrying various mutant cis-elements 970M4, 950M, 970M, 950i, 970i, and 970M4i.

