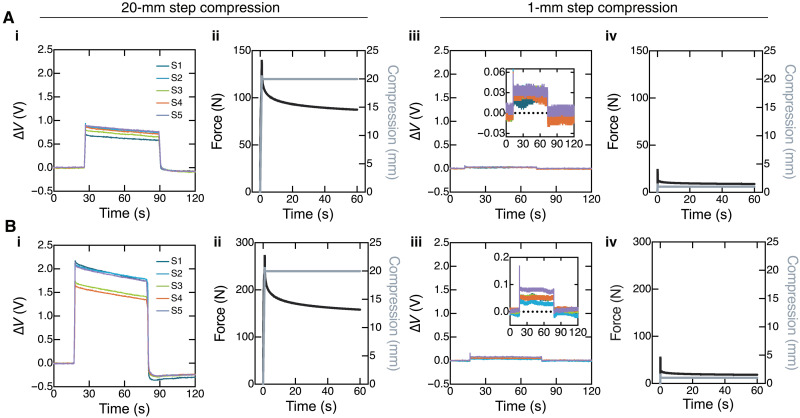
Fig. 3. Characterizing fluidic sensor responses during step compressions.
Sensor and mechanical responses are provided for sensorized (A) BCC and (B) octahedral lattices undergoing step compressions. Plots (i) and (iii) provide sensor voltage change, ∆V, over time for the five fluidic sensors, S1 to S5, during 20- and 1-mm step compressions, respectively. Plots (ii) and (iv) provide the corresponding force and compression data over time, as measured via Instron during 60-s step compressions of 20 and 1 mm, respectively. The insets in (A, iii) and (B, iii) are scaled to observe the small but measurable sensor changes in response to 1 mm of compression. ∆V = 0 is indicated in the insets by the dotted black line.

