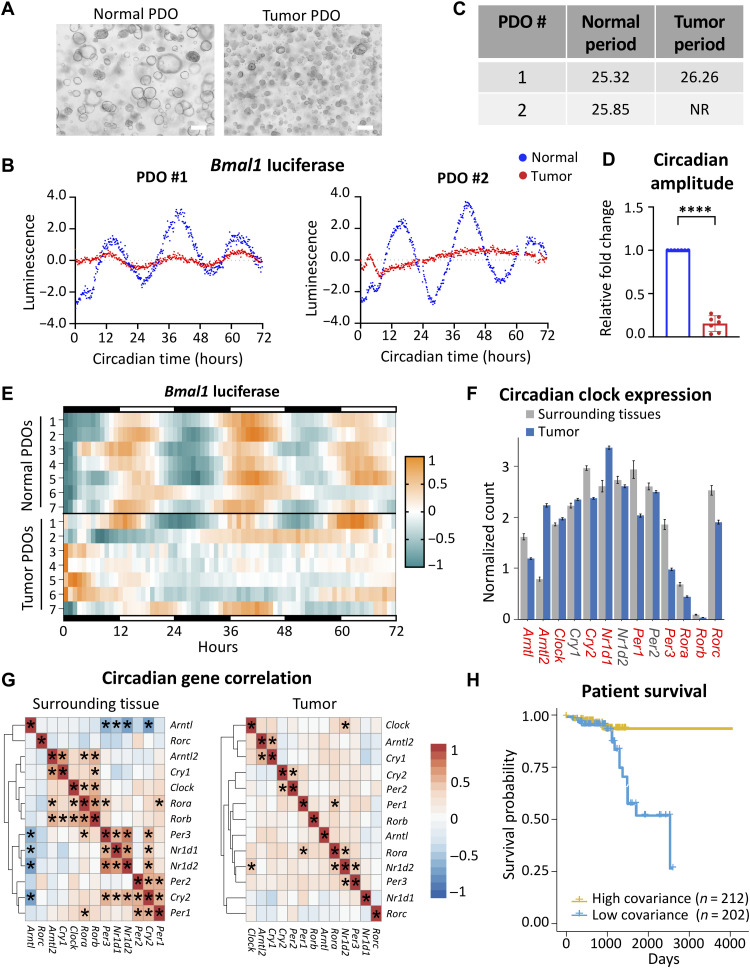
Fig. 6. The circadian clock is disrupted in human CRC.
(A) Representative bright-field microscopy images of organoids established from normal and tumor tissue from the same patient. Scale bars, 100 μm. (B) Detrended Bmal1-driven luminescence over time for matched normal and tumor PDOs. (C) Circadian period from PDOs was calculated in matched normal and tumor intestinal organoids using BioDare2. NR, nonrhythmic. (D) Circadian amplitude for each tumor-derived PDO normalized to the matched normal PDO from each of seven pairs. Amplitude was calculated using BioDare2. Data represent the mean ± SEM, and statistical significance was determined using Wilcoxon’s matched-pair signed-rank test. Asterisks represent the P value, with ****P < 0.0001. (E) Circadian rhythmicity determined by Bmal1-luciferase reporter activity of matched PDO pairs over 72 hours presented as a heatmap. Each row represents a normal or tumor PDO line (n = 7 independent PDO pairs). (F) Core clock gene expression in normal surrounding tissue (n = 57) versus colorectal tumors (n = 470) using TCGA. Data represent the mean ± SEM, and comparisons with a P value lower than 0.001 (two-way Student’s t test) are labeled red. (G) Heatmaps showing the correlation of gene expression among core clock genes in normal surrounding tissue and colorectal tumors. Asterisks represent significant covariance, where P < 0.001. (H) Patients with CRC in TCGA were binned into high-covariance (n = 212) or low-covariance (n = 202) categories on the basis of variance between core clock and Wnt pathway genes and shown relative to overall survival probability. P value was estimated using the log-rank method from Kaplan-Meier curves, P = 0.0032.

