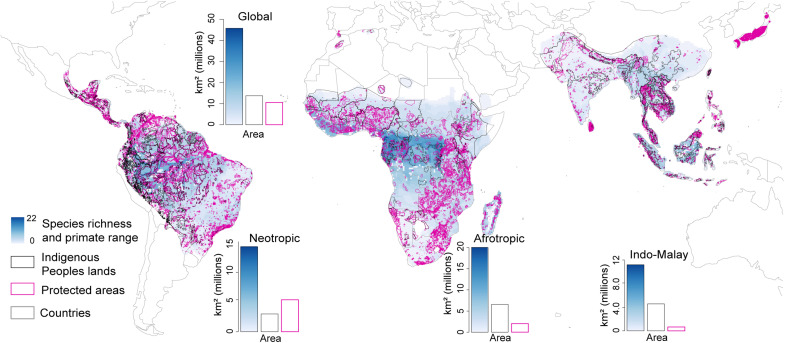
Fig. 3. Global geographic overlap among primate distributions, Indigenous Peoples’ lands, and protected areas.
The primate species range data source was the IUCN Red List 2021. The number of primate species per realm is indicated to the immediate right or left of that region. We defined species richness as the overlap of the polygons describing the geographic distributions of all primate species onto a cell grid of 0.5° resolution in latitude and longitude. Numbers by each region refer to the number of primate species present. The source of data on Indigenous Peoples’ lands is from (21). Protected areas from Protected Planet (50). For this spatial analysis, we did not separate protected areas into their different categories; we considered categories I to VI as a group. The resolution may be inexact because boundaries between Indigenous and other lands are often contested. Given Madagascar’s unique situation regarding no Indigenous Peoples, we estimated that its primate range encompasses an area of ~0.469 million km2 or 80% of Madagascar’s land area (ca 587,041 km2); protected areas account for 17% of the primate range and other lands 83% (Table 1 and fig. S5).

