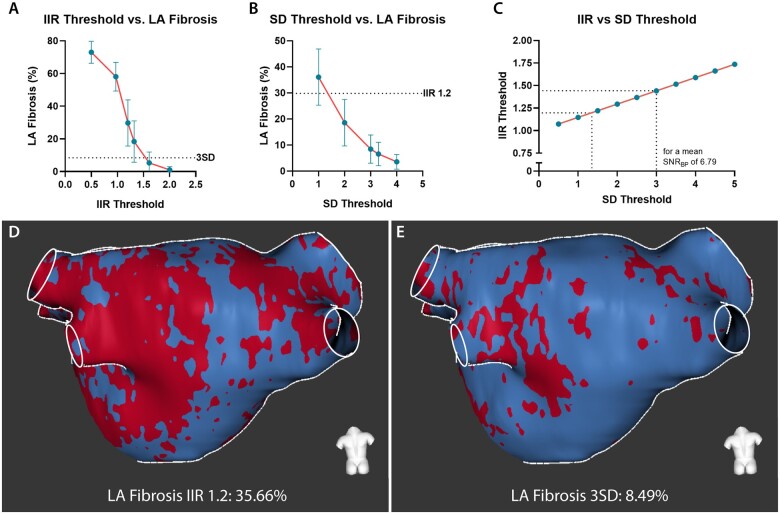
Figure 3.
Difference in quantified LA fibrosis using different methods and thresholds. (A) LA fibrosis quantified in CEMRG using different IIR threshold values (i.e. 0.5, 0.97, 1.2, 1.32, 1.61, 2.0). (B) LA fibrosis quantified in CEMRG using different SD threshold values (i.e. 1.0, 2.0, 3.0, 3.3, 4.0). (C) the relation between IIR and SD for a mean blood pool SNR of 6.79. (D) LA fibrosis assessed using IIR 1.2, LA fibrosis 35.66%. (E) LA fibrosis from the same patient as indicated in (C) assessed using 3SD, LA fibrosis 8.49%.

