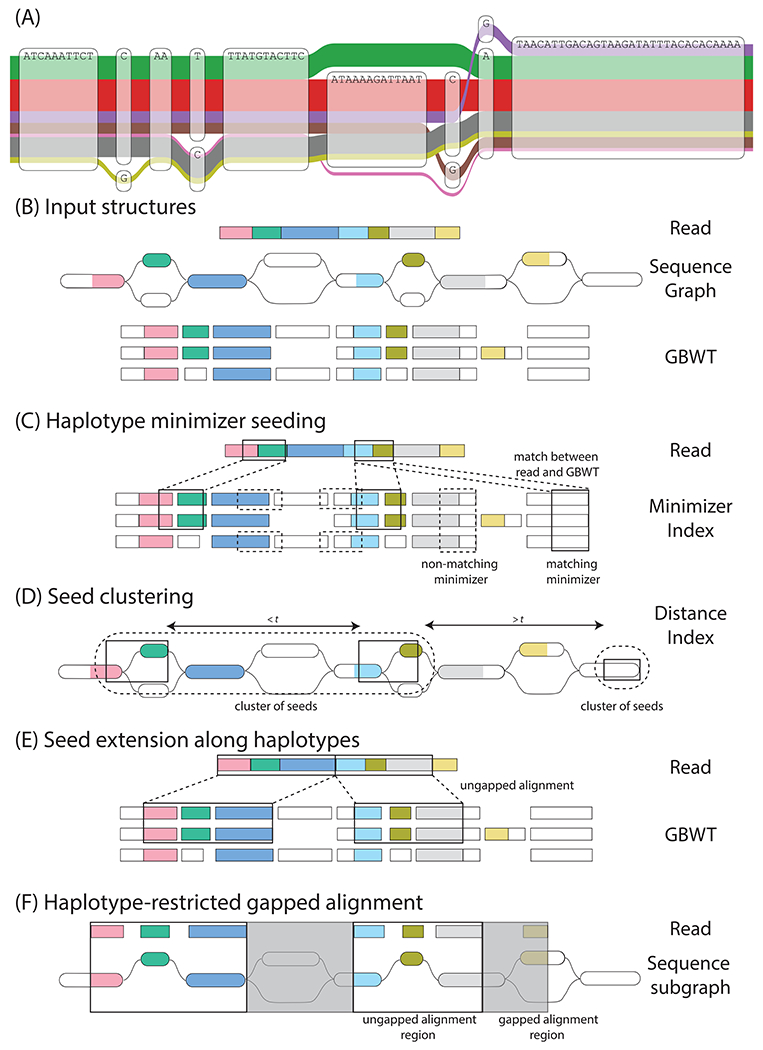
Figure 1.

Haplotype mapping. (A) A region of the CASP12 gene in the 1000GP graph (17), illustrating complex local variation. The observed haplotypes (the colored ribbons of width log-proportional to population frequency) represent only a subset of the possible paths through the graph. (B-F) An overview of Giraffe. (B) Input structures: Giraffe takes as input each read to map, the sequence graph reference to map against, and the GBWT of known haplotypes to restrict to. The input read is represented as a series of colored rectangles. The haplotype sequences in the GBWT are similarly represented as series of rectangles, split according to the nodes they correspond to in the sequence graph. Nodes in the sequence graph and haplotypes in the GBWT are colored according to homology with the read. (C) Haplotype minimizer seeding: Seeds are identified using an index of minimizers (subsets of sequences of specified length k) (53) over the sequences of all the GBWT haplotypes. A matching minimizer between the read and the GBWT haplotypes constitutes a seed. The minimizers (black boxes) in the read are enumerated and the matching minimizers in the haplotypes are identified using the minimizer index. (D) Seed clustering: Minimizer instances in the graph are clustered by the minimum graph distance (t, measured in nucleotides) between them (54). (E) Seed extension along haplotypes: Minimizers in high scoring clusters are extended linearly to form maximal gapless local alignments. (F) Haplotype-restricted gapped alignment: Giraffe is designed on the assumption that, for most reads, it will be possible to gaplessly extend seed alignments all the way to the ends of the read, allowing the algorithm to stop at the previous step. However, any remaining gaps in the alignment between read and graph are resolved by gapped alignment in this final step.
