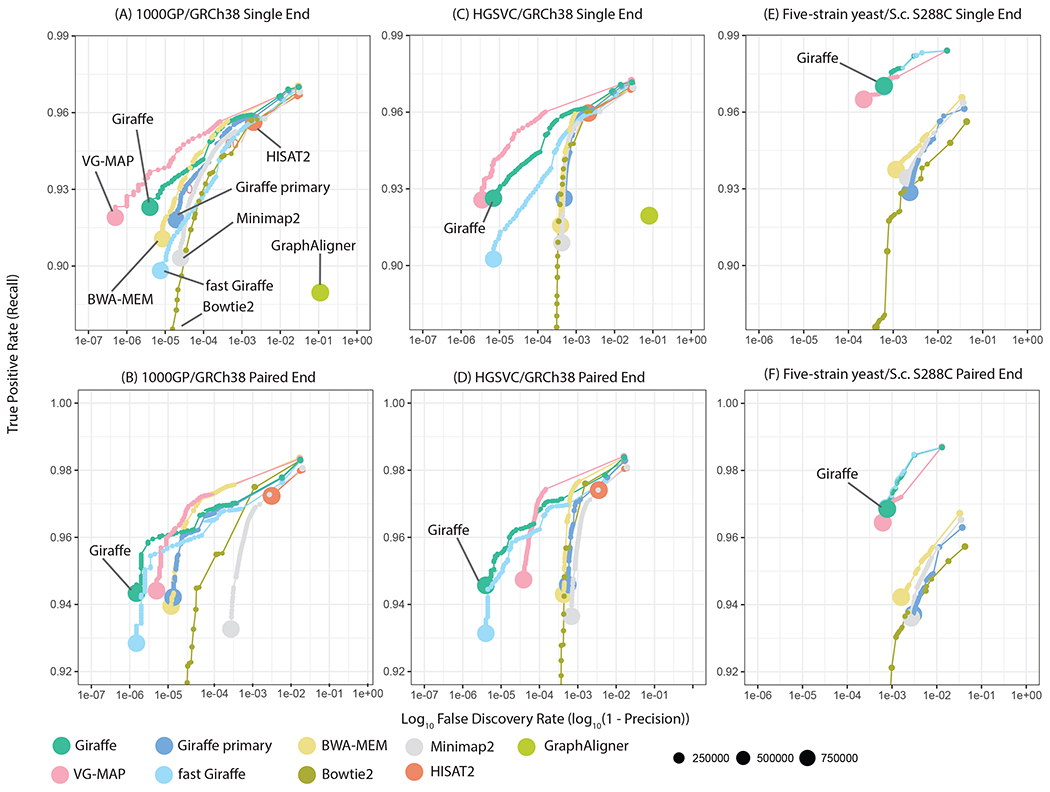
Figure 2.

Simulated read mapping. Each panel shows recall vs. FDR (false discovery rate, or 1 minus precision) for a simulated read mapping experiment, comparing Giraffe to linear genome mappers (BWA-MEM, Bowtie2, Minimap2) and other genome graph mappers (VG-MAP, GraphAligner, HISAT2). Reads were simulated to match ~ 150 bp Illumina NovaSeq (for human) or HiSeq 2500 (for yeast) reads, either as single-ended reads (A-C) or as paired-end reads (D-F) (17). Results for each mapper are shown stratified by reported read mapping quality; the size of each point represents the log-scaled number of reads with the corresponding mapping quality. Three different mapping scenarios are assessed: (A,D) Comparing mapping to a graph derived from the 1000GP data to mapping to the linear reference genome assembly upon which it is based (GRCh38). (B,E) Comparing mapping to a graph containing larger structural variants from the HGSVC project to mapping to the GRCh38 assembly upon which it is based. (C,F) Comparing mapping to a multiple sequence alignment based yeast graph to mapping to the single S.c. S288C linear reference, for reads from the DBVPG6044 strain. For mapping with Giraffe, we used the full GBWT containing 6 haplotypes to map to the HGSVC graph and the 64-haplotype sampled GBWT to map to the 1000GP graph. “Giraffe primary” represents mapping with Giraffe to the linear reference.
