
Figure 5.
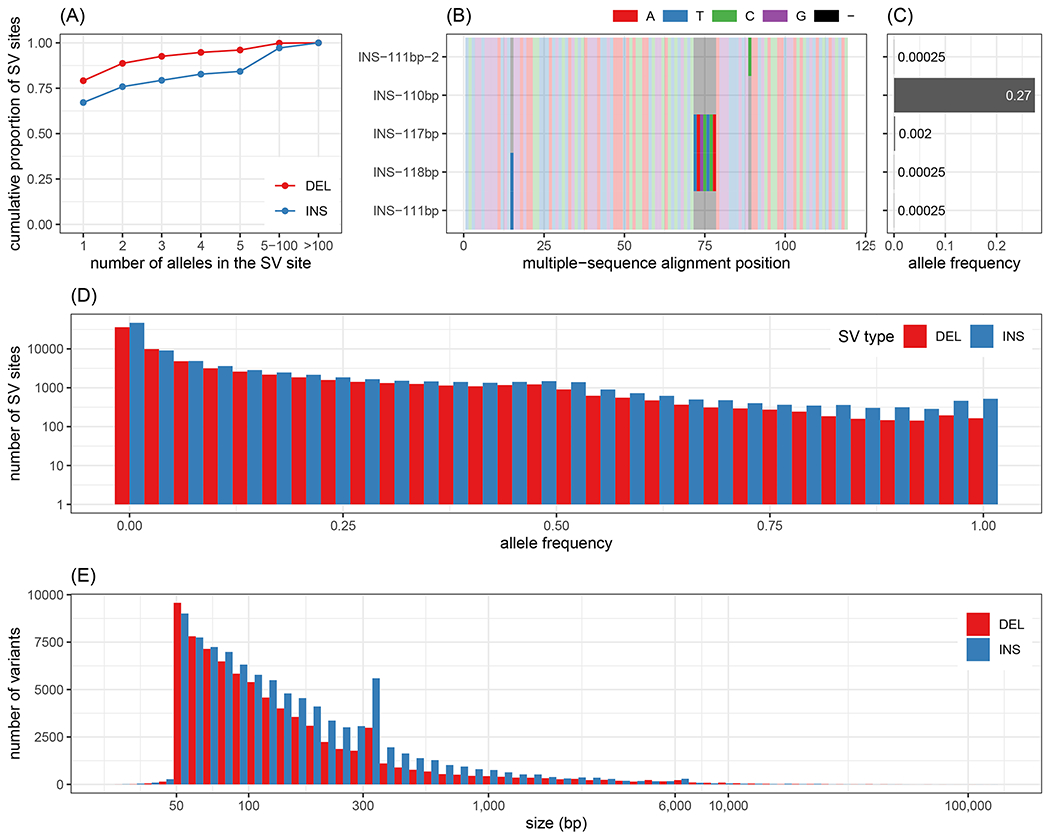
Structural variants in the Multi-Ethnic Study of Atherosclerosis (MESA) cohort. (A) Cumulative proportion of SV sites depending on the maximum number of alleles (x-axis) in the site. (B-C) illustrates an insertion site with 5 alleles. The alleles differ by 3 nested indels as shown by the multiple sequence alignment of the inserted sequences represented in (B). Only one allele is frequent in the population (AF=0.27) as highlighted by (C). (D) Allele frequency distribution of the major allele for each SV site. The y-axis, showing the number of SVs, is log-scaled. (E) Size distribution of the major allele for each SV site.