. 2022 Feb 7;28(9):1948–1965. doi: 10.1158/1078-0432.CCR-21-1299

Figure 1.

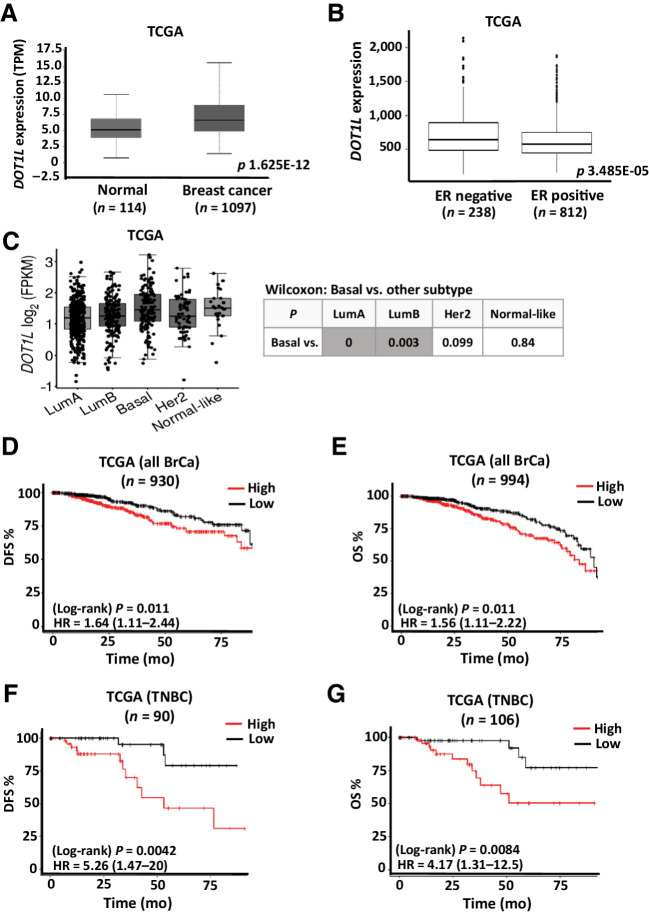
Figure 1. Prognostic value of DOT1L expression in breast cancer. A, Box plot comparing DOT1L gene expression in breast cancer (n = 1,097) and normal breast tissue (n = 114) using TCGA data set. (The data figure was generated using UALCAN cancer OMICS web portal) (50). B, Box plot comparing DOT1L gene expression in estrogen receptor positive (n = 812) and estrogen receptor negative (n = 238) in TCGA data set downloaded from cBioPortal. C, Gene-expression analysis of DOT1L expression (FPKM) in breast cancer subtypes using TCGA data set. Nonparametric Wilcoxon test P values for comparison of basal vs. each subtype is tabulated. (The data figure was generated using tumorsurvival.org portal.) D and E, Breast cancer data from TCGA was downloaded from cbioportal.org. Kaplan–Meier analysis shows association of DOT1L gene expression above or below median expression with DFS or OS, for patients who had disease recurrence (D) or who died within 8 years (E). F and G, TNBC data from TCGA were downloaded from cbioportal.org. Kaplan–Meier analysis shows association of DOT1L gene expression above or below median expression with RFS (F) or OS (G), for TNBC patients who had disease recurrence or who died within 8 years, respectively. HA = hazard ratio; log-rank P values are shown. See also Supplementary Fig. S1.

Prognostic value of DOT1L expression in breast cancer. A, Box plot comparing DOT1L gene expression in breast cancer (n = 1,097) and normal breast tissue (n = 114) using TCGA data set. (The data figure was generated using UALCAN cancer OMICS web portal) (50). B, Box plot comparing DOT1L gene expression in estrogen receptor positive (n = 812) and estrogen receptor negative (n = 238) in TCGA data set downloaded from cBioPortal. C, Gene-expression analysis of DOT1L expression (FPKM) in breast cancer subtypes using TCGA data set. Nonparametric Wilcoxon test P values for comparison of basal vs. each subtype is tabulated. (The data figure was generated using tumorsurvival.org portal.) D and E, Breast cancer data from TCGA was downloaded from cbioportal.org. Kaplan–Meier analysis shows association of DOT1L gene expression above or below median expression with DFS or OS, for patients who had disease recurrence (D) or who died within 8 years (E). F and G, TNBC data from TCGA were downloaded from cbioportal.org. Kaplan–Meier analysis shows association of DOT1L gene expression above or below median expression with RFS (F) or OS (G), for TNBC patients who had disease recurrence or who died within 8 years, respectively. HA = hazard ratio; log-rank P values are shown. See also Supplementary Fig. S1.