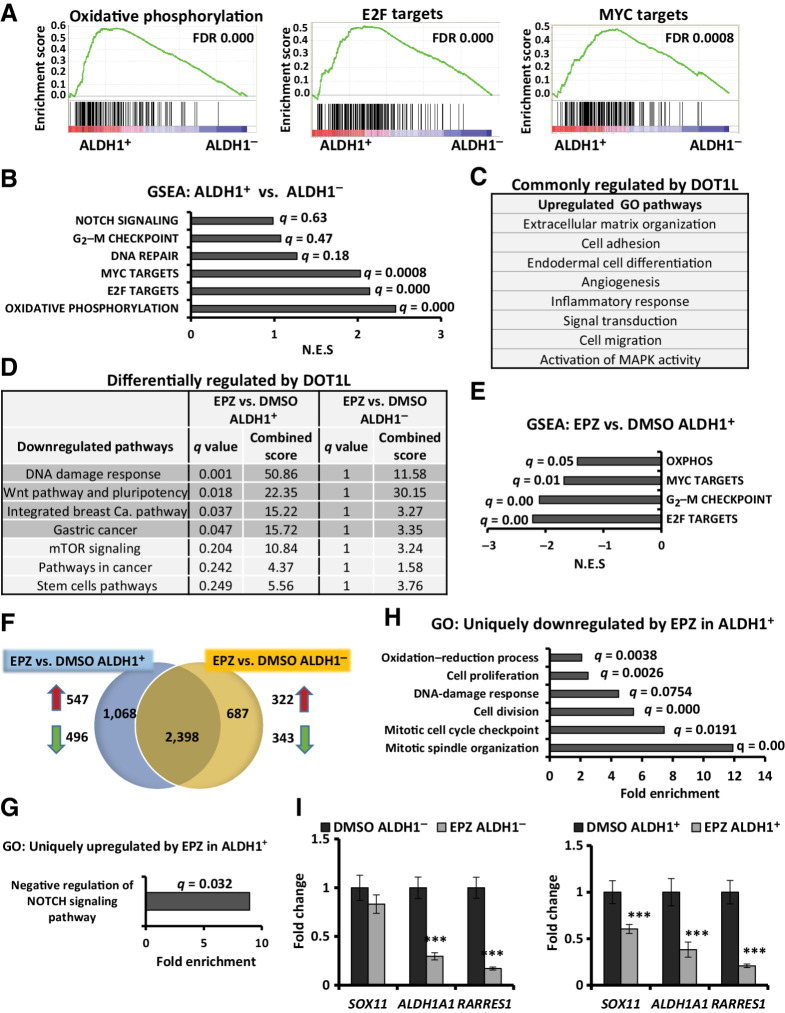
Figure 5.
DOT1L inhibition downregulates gene profiles of oxidative phosphorylation, cell division, and WNT pathway specifically in ALDH1+ cells. RNA-seq was performed in three independent biological ALDH1+ and ALDH1− cell populations collected after 10 days of treatment with DMSO or 0.5 μmol/L EPZ-5676. A, GSEA plots representing the three most significantly enriched clusters in 468 ALDH1+ cells vs. ALDH1− populations. B, Gene profiles overrepresented in ALDH1+ vs. ALDH1− cells, with respective FDR/q values and normalized enrichment scores of data graphed in A and Supplementary Fig. S3A. C, GO analysis for genes upregulated (fold change ≥ 2; q ≤ 0.05) in both EPZ-5676–treated ALDH1+ and ALDH1− populations compared with respective DMSO controls. D, WIKI/KEGG pathway analysis of the downregulated genes (fold change ≤ 0.7; q ≤ 0.05) in drug-treated vs. control cells. Gray highlighted pathways are significantly downregulated in EPZ-5676–treated ALDH1+ cells (q ≤ 0.05) but not in drug-treated ALDH1− cells (q = 1). E, GSEA comparing EPZ-5676–treated ALDH1+ vs. DMSO-treated ALDH1+ cells shows gene sets downregulated by treatment. F, Venn diagram displays genes whose expression is either commonly or differently altered by EPZ-5676 (EPZ) treatment in isolated ALDH1+ and ALDH1− populations compared with their respective DMSO controls: 547 genes were uniquely upregulated and 496 genes were uniquely downregulated in drug-treated ALDH1+ cells; 322 genes were uniquely upregulated and 343 genes were uniquely downregulated in response to drug in ALDH1− cells. G, GO analysis for genes significantly upregulated only in drug-treated ALDH1+ cells (547 genes). Biological processes shown with FDR q ≤ 0.05. H, GO analysis for genes significantly downregulated only in drug-treated ALDH1+ cells (496 genes). Biological processes shown with FDR q ≤ 0.05. I, qPCR gene expression of SOX11, ALDH1A1, and RARRES1 in drug- or DMSO-treated ALDH1− (left) and ALDH1+ populations (right). ***, P ≤ 0.001. See also Supplementary Fig. S3.

