Figure 1.
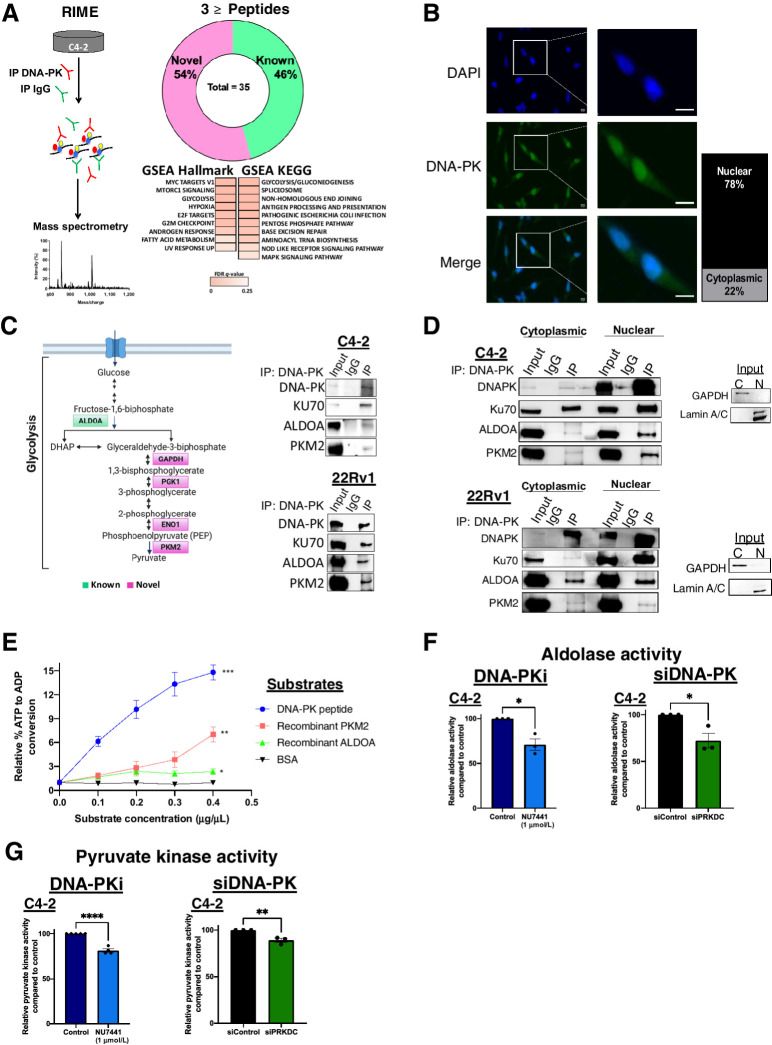
DNA-PK interacts with glycolytic enzymes and promotes enzymatic activity. A, Schematic of RIME proteins in C4–2 cell line. Donut plot of known and novel DNA-PK partners, GSEA hallmark and KEGG gene set analysis. B, DNA-PK localization in C4–2 cells: DAPI (blue), DNA-PK (green). DNA-PK levels are quantified (right). C, Simplified schematic of glycolysis pathway highlighting known (green) and novel (magenta) DNA-PK partners identified by RIME. ALDOA and PKM2 interaction with DNA-PK in CRPC whole cell lysates. D, Cytoplasmic and nuclear Interaction of DNA-PK with ALDOA and PKM2 in CRPC cell lines (C4–2 top, 22Rv1 bottom). E,In vitro DNA-PK kinase assay using ALDOA and PKM2 as substrates, DNA-PK peptide (positive control), and BSA (negative control). Aldolase activity assay (F) and pyruvate kinase activity assay (G) after DNA-PK inhibition (NU7441, 1 μmol/L, 3 hours) and DNA-PK knockdown (96 hours posttransfection). Data collected in at least three biological replicates, represented as mean ± SEM (*, P < 0.05; **, P < 0.01; ***, P < 0.001).

