. 2022 Jan 24;28(7):1446–1459. doi: 10.1158/1078-0432.CCR-21-1846

Figure 2.

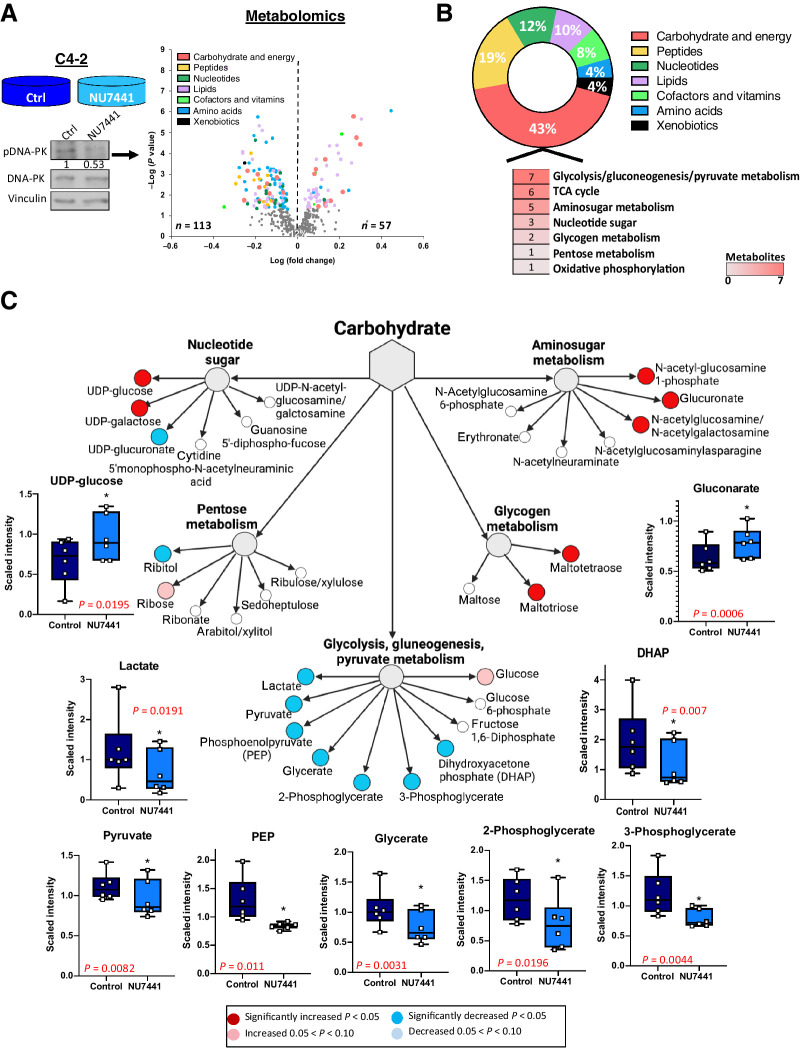
Figure 2. DNA-PK activity modulates metabolic pathways and results in significant changes in carbohydrate metabolism. A, Steady-state metabolomics performed in C4–2 cells in DMSO vs. NU7441 (1 μmol/L, 24 hours). Increased and decreased metabolites shown in the scatter plot for each super-pathway. B, Relative percent of metabolites changed (up and down) compared with total number of metabolites identified in each super-pathway. C, Metabolites changed in each carbohydrate subpathway with glycolysis having the most changed metabolites shown by box and whisker plots.

DNA-PK activity modulates metabolic pathways and results in significant changes in carbohydrate metabolism. A, Steady-state metabolomics performed in C4–2 cells in DMSO vs. NU7441 (1 μmol/L, 24 hours). Increased and decreased metabolites shown in the scatter plot for each super-pathway. B, Relative percent of metabolites changed (up and down) compared with total number of metabolites identified in each super-pathway. C, Metabolites changed in each carbohydrate subpathway with glycolysis having the most changed metabolites shown by box and whisker plots.