. 2022 Jan 24;28(7):1446–1459. doi: 10.1158/1078-0432.CCR-21-1846

Figure 3.

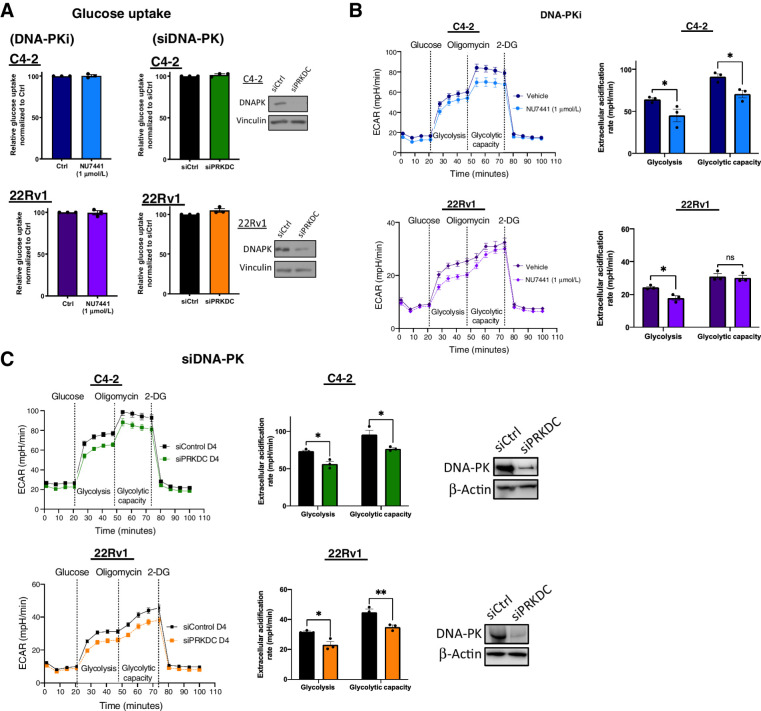
Figure 3. DNA-PK impacts overall glycolytic activity. A, Glucose uptake was measured upon DNA-PK inhibition (NU7441, 1 μmol/L, 24 hours) and DNA-PK knockdown (96 hours posttransfection) using a fluorescence glucose analog, 2NBDG. B and C, Glycolysis stress test seahorse performed upon DNA-PK inhibition (B; NU7441, 1 μmol/L, 24 hours) and DNA-PK knockdown (C; 96 hours posttransfection). ECAR was quantified and shown (right). Glycolysis was measured after glucose stimulation and prior to oligomycin treatment. Glycolytic capacity was measured after oligomycin stimulation and prior to 2-DG. Data collected in at least three biological replicates, represented as mean ± SEM (ns, nonsignificant; *, P < 0.05; **, P < 0.01; ***, P < 0.001).

DNA-PK impacts overall glycolytic activity. A, Glucose uptake was measured upon DNA-PK inhibition (NU7441, 1 μmol/L, 24 hours) and DNA-PK knockdown (96 hours posttransfection) using a fluorescence glucose analog, 2NBDG. B and C, Glycolysis stress test seahorse performed upon DNA-PK inhibition (B; NU7441, 1 μmol/L, 24 hours) and DNA-PK knockdown (C; 96 hours posttransfection). ECAR was quantified and shown (right). Glycolysis was measured after glucose stimulation and prior to oligomycin treatment. Glycolytic capacity was measured after oligomycin stimulation and prior to 2-DG. Data collected in at least three biological replicates, represented as mean ± SEM (ns, nonsignificant; *, P < 0.05; **, P < 0.01; ***, P < 0.001).