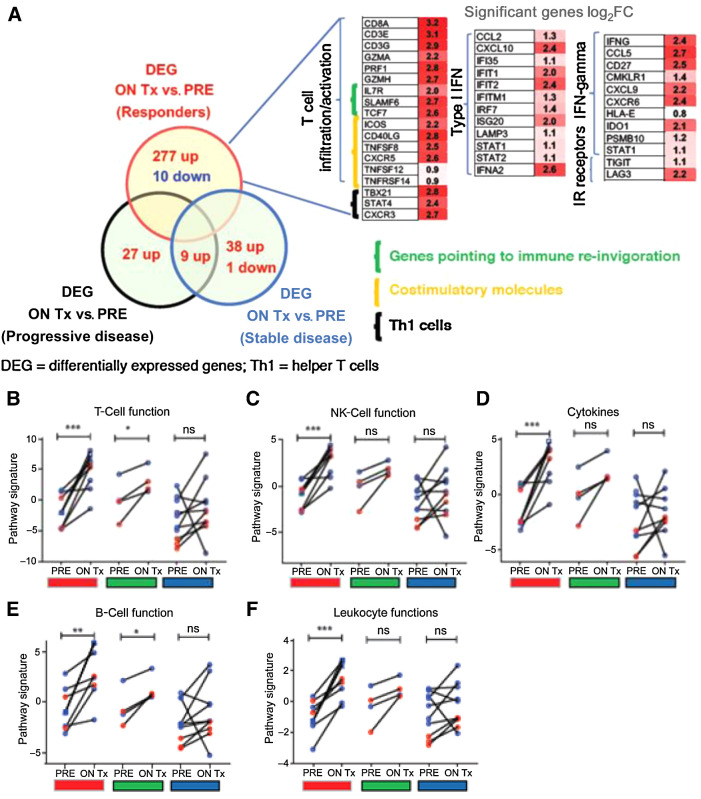
Figure 3.
Treatment with SD-101 and pembrolizumab induces increased transcripts associated with A. T-cell function (B), NK-cell function (C), pro-inflammatory cytokines (D), B-cell function (E), and leukocyte function (F). These increases were observed primarily in responding patients (red) although there were also significant increases in the expression of transcripts associated with B- and T-cell function in patients with stable disease (green) as the best response. Data shown as open red circles (2 mg cohort) and blue circles (8 mg cohort). All patients included in the analysis had one biopsy at baseline and second biopsy 1 week following the fourth SD-101 treatment. One patient received two additional biopsies at day 106 (3 weeks after the sixth SD-101 injection, blue square) and day 190 (3 weeks after the 10th SD-101 injection, blue triangle). F, Broad changes in gene expression were observed primarily in responding patients including increased transcripts associated with T-cell infiltration and activation, type I IFN, IFNγ, and IR receptors. A–E, All statistical analyses were performed using Prism software v5 (GraphPad Software). A two-tailed paired t test was done between matched on-treatment (ON Tx) and baseline (PRE) biopsies. F, Analysis of changes in gene expression was performed using nSolver software (Nanostring). Differentially expressed genes (DEG; cutoff:LOG2FC ± 0.6, P = 0.05) in between matched on-treatment (ON Tx) and baseline (PRE) biopsies. *, P ≤ 0.05; **, P ≤ 0.01; ***, P ≤ 0.001; and ****, P ≤ 0.0001.

