. 2022 Feb 11;28(9):1966–1978. doi: 10.1158/1078-0432.CCR-21-0344

Figure 2.

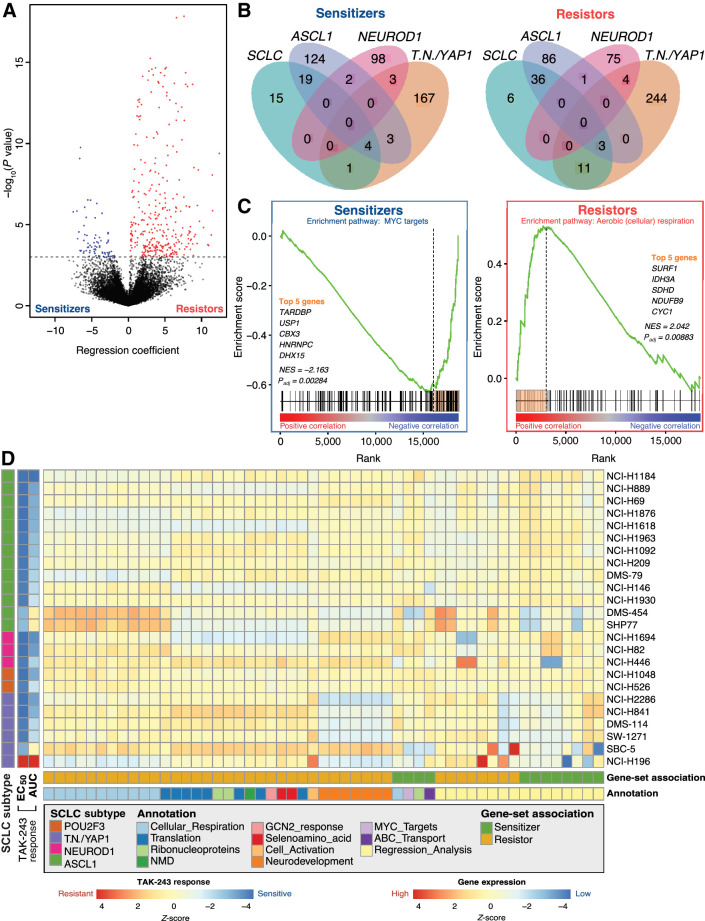
Figure 2. Candidate gene-sets are putative biomarkers of TAK-243 response in SCLC cell lines. A, Volcano plot showing results of TAK-243 EC50 regression analysis where the x-axis represents the regression coefficient assigned to each gene and the y-axis represents significance. Genes highlighted in blue represent sensitizer genes (expression is significantly negatively correlated with EC50; FDR < 0.05) and red genes represent resistor genes (expression is significantly positively correlated with EC50; FDR < 0.05). The dotted black horizontal line represents the significance threshold (Padj < 0.05). B, Venn diagram showing overlaps of sensitizer (left) and resistor (right) genes identified from each of the four regression analyses: All SCLC cell lines, ASCL1-high cell lines only, TN/YAP1-high cell lines only, and NEUROD1-high cell lines only. C, Representative example of how leading-edge genes were selected through GSEA to identify sensitizer (left) and resistor (right) pathways from across SCLC cell lines and subtypes. Leading-edge genes (highlighted orange bar) were used as potential biomarkers for TAK-243 response. MYC target (sensitizer) and aerobic respiration (cellular respiration; resistor) are depicted. D, Heatmap of scaled ssGSEA enrichment score for each set of biomarker genes identified from the regression or pathway analyses used to identify TAK-243 response in subsets of SCLC cell lines and subsequently applied to each SCLC cell line.

Candidate gene-sets are putative biomarkers of TAK-243 response in SCLC cell lines. A, Volcano plot showing results of TAK-243 EC50 regression analysis where the x-axis represents the regression coefficient assigned to each gene and the y-axis represents significance. Genes highlighted in blue represent sensitizer genes (expression is significantly negatively correlated with EC50; FDR < 0.05) and red genes represent resistor genes (expression is significantly positively correlated with EC50; FDR < 0.05). The dotted black horizontal line represents the significance threshold (Padj < 0.05). B, Venn diagram showing overlaps of sensitizer (left) and resistor (right) genes identified from each of the four regression analyses: All SCLC cell lines, ASCL1-high cell lines only, TN/YAP1-high cell lines only, and NEUROD1-high cell lines only. C, Representative example of how leading-edge genes were selected through GSEA to identify sensitizer (left) and resistor (right) pathways from across SCLC cell lines and subtypes. Leading-edge genes (highlighted orange bar) were used as potential biomarkers for TAK-243 response. MYC target (sensitizer) and aerobic respiration (cellular respiration; resistor) are depicted. D, Heatmap of scaled ssGSEA enrichment score for each set of biomarker genes identified from the regression or pathway analyses used to identify TAK-243 response in subsets of SCLC cell lines and subsequently applied to each SCLC cell line.