. 2022 Feb 11;28(9):1966–1978. doi: 10.1158/1078-0432.CCR-21-0344

Figure 5.

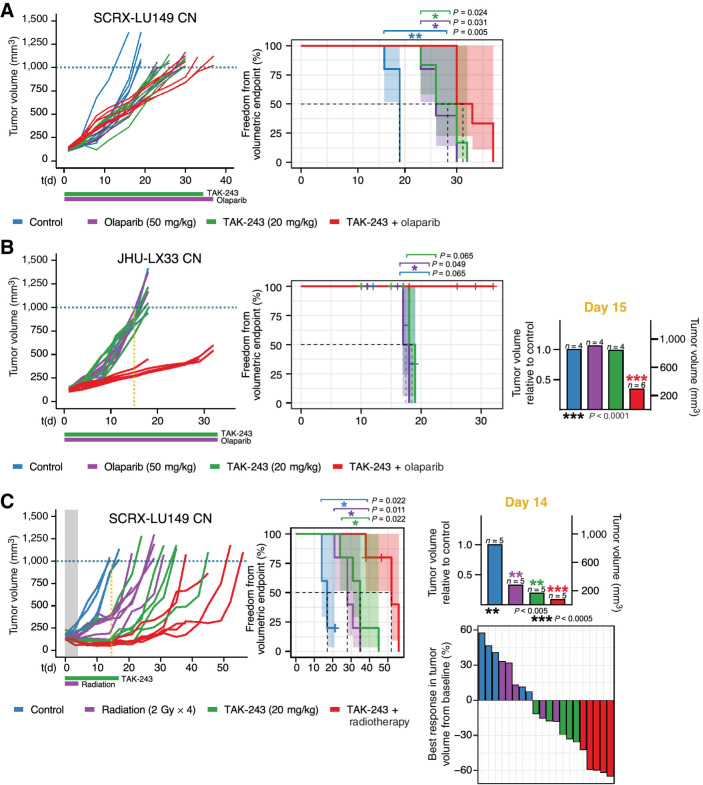
Figure 5. TAK-243 synergizes with genotoxic therapies in TAK-243 monotherapy sensitive and resistant SCLC PDX models. Individual PDX tumor growth curves (left) and Kaplan–Meier survival plots (middle) of SCRX-LU149 CN (A and C) and JHU-LX33 CN (B). PDX models after treatment with either vehicle control, olaparib (50 mg/kg, 5 times/week until termination, oral), TAK-243 (20 mg/kg, biweekly × 5 weeks, intravenous), and TAK-243–olaparib (TAK-243 20 mg/kg, olaparib 50 mg/kg; A and B) or vehicle control, TAK-243 (20 mg/kg, biweekly × 3 weeks, intravenous), radiation (2G x 4), and TAK-243 + radiotherapy combination (TAK-243 20 mg/kg, radiotherapy 2G x 4, C). Dosing schedule is indicated below x-axis of growth-response curves: the horizontal green and purple lines represent period of TAK-243 and olaparib or radiation dosing, respectively. Freedom from volumetric endpoint (1,000 mm3, indicated by the dotted line in each growth curve) was determined by Kaplan–Meier survival analysis. For the Kaplan–Meier curves shaded areas represent the 95% CIs around each curve, and the dotted line, the median freedom from volumetric endpoint. The log-rank test was used to evaluate statistical significance, with adjusted P values to account for multiple tests. B, TAK-243 synergizes most with olaparib in the TAK-243, olaparib monotherapy resistant JHU-LX33 CN SCLC PDX model. Middle, Kaplan–Meier curve analysis for the control, TAK-243, and olaparib single agent groups was calculated by creating variance between groups artificially (+ or −1 day per each event) to enable visualization of each curve. Right, Average tumor volume of olaparib, TAK-243-, and combination-treated mice relative to control on day 15 of treatment. TAK-243 + olaparib–treated mice had significantly smaller tumors 15 days following treatment compared with all other groups (unpaired t test, P < 0.0001). C (right, top, TAK-243 + radiotherapy–treated mice had significantly smaller tumors 14 days following treatment compared with all other groups (unpaired t test, P < 0.0005). Waterfall plot (right, bottom) depicting the best response of individual mice treated with control, TAK-243, radiotherapy, or TAK-243 + radiotherapy. Best response was considered as the smallest tumor volume (compared with baseline) over the course of the study. The gray shaded area and the purple horizontal line of radiation indicates duration of time in which combination therapy overlapped. RT, radiotherapy; PDX, patient derived xenograft.

TAK-243 synergizes with genotoxic therapies in TAK-243 monotherapy sensitive and resistant SCLC PDX models. Individual PDX tumor growth curves (left) and Kaplan–Meier survival plots (middle) of SCRX-LU149 CN (A and C) and JHU-LX33 CN (B). PDX models after treatment with either vehicle control, olaparib (50 mg/kg, 5 times/week until termination, oral), TAK-243 (20 mg/kg, biweekly × 5 weeks, intravenous), and TAK-243–olaparib (TAK-243 20 mg/kg, olaparib 50 mg/kg; A and B) or vehicle control, TAK-243 (20 mg/kg, biweekly × 3 weeks, intravenous), radiation (2G x 4), and TAK-243 + radiotherapy combination (TAK-243 20 mg/kg, radiotherapy 2G x 4, C). Dosing schedule is indicated below x-axis of growth-response curves: the horizontal green and purple lines represent period of TAK-243 and olaparib or radiation dosing, respectively. Freedom from volumetric endpoint (1,000 mm3, indicated by the dotted line in each growth curve) was determined by Kaplan–Meier survival analysis. For the Kaplan–Meier curves shaded areas represent the 95% CIs around each curve, and the dotted line, the median freedom from volumetric endpoint. The log-rank test was used to evaluate statistical significance, with adjusted P values to account for multiple tests. B, TAK-243 synergizes most with olaparib in the TAK-243, olaparib monotherapy resistant JHU-LX33 CN SCLC PDX model. Middle, Kaplan–Meier curve analysis for the control, TAK-243, and olaparib single agent groups was calculated by creating variance between groups artificially (+ or −1 day per each event) to enable visualization of each curve. Right, Average tumor volume of olaparib, TAK-243-, and combination-treated mice relative to control on day 15 of treatment. TAK-243 + olaparib–treated mice had significantly smaller tumors 15 days following treatment compared with all other groups (unpaired t test, P < 0.0001). C (right, top, TAK-243 + radiotherapy–treated mice had significantly smaller tumors 14 days following treatment compared with all other groups (unpaired t test, P < 0.0005). Waterfall plot (right, bottom) depicting the best response of individual mice treated with control, TAK-243, radiotherapy, or TAK-243 + radiotherapy. Best response was considered as the smallest tumor volume (compared with baseline) over the course of the study. The gray shaded area and the purple horizontal line of radiation indicates duration of time in which combination therapy overlapped. RT, radiotherapy; PDX, patient derived xenograft.