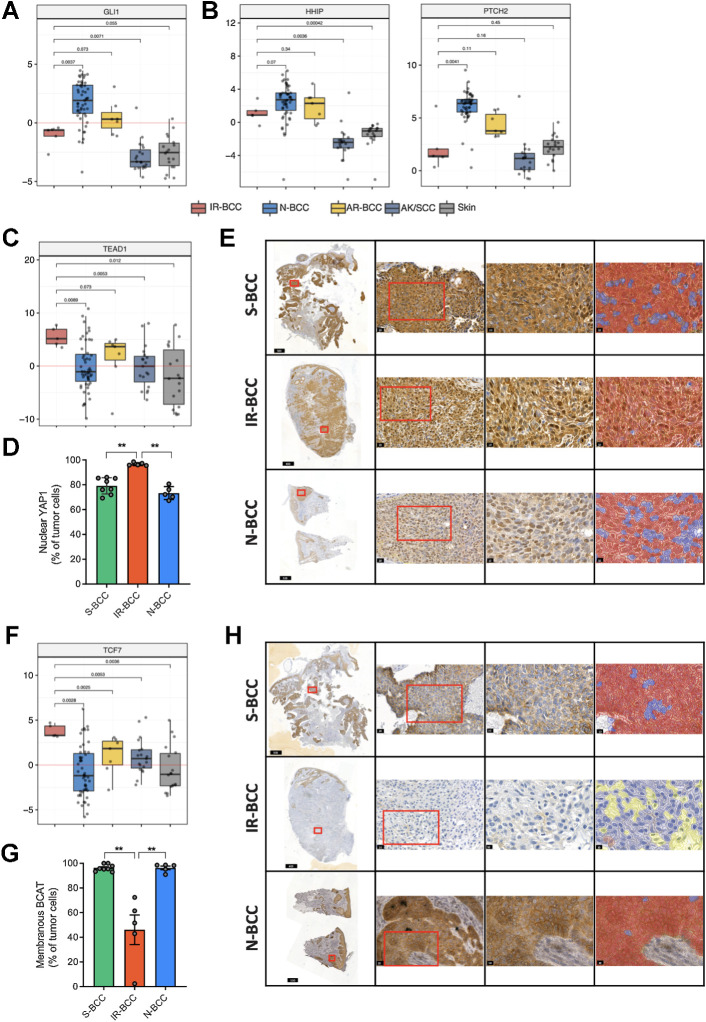
Figure 4.
Transcriptional activity and immunohistochemical analysis of the Hedgehog, Hippo-YAP, and WNT markers in BCC. A, Relative activity of the central Hedgehog TF GLI1 based on the expression of its transcription targets in different groups of skin tumors and normal skin. B, RNA expression (logTPM values) of the HHIP and PTCH2 genes which are usually activated in BCC. C, Relative activity of the central HIPPO-YAP TF TEAD1 based on the expression of its transcription targets in different groups of skin tumors and normal skin. D, Quantification of nuclear YAP1 protein expression in tumor cells (% of total tumor cells) among the three groups of samples assessed by YAP1 enzymatic IHC. E, Representative micrographs for YAP1 expression in BCC groups at various magnifications: tumor overview on the whole-slide scan (first column), details of the regions marked with a red square in the first column (20× magnification, second column), and details of regions marked with red square in the second column (40× magnification, third column) with overlapping color mask (fourth column) marking nuclear YAP1-positive cells (red mask). Nuclear YAP1-negative tumor cells are marked in blue. The parts of the image are intentionally duplicated in Supplementary Figs. S2–S4 for S-BCC, IR-BCC, and N-BCC samples, respectively, as the same slides represented. F, Relative activity of the central WNT TF TCF7 based on the expression of its transcription targets in different groups of samples. G, Quantification of membranous BCAT expression in the tumor cells (% of total tumor cells) in the three groups of samples assessed by BCAT enzymatic IHC. H, Representative micrographs for BCAT expression in BCC groups at various magnifications: tumor overview on the whole-slide scan (first column), details of the regions marked with a red square in the first column (20× magnification, second column), and details of regions marked with red square in the second column (40× magnification, third column) with overlapping color mask (fourth column) marking membranous BCAT-positive cells (red mask). BCAT-negative tumor cells are marked in blue and nontumor cells are marked in yellow. The parts of the image are intentionally duplicated in Supplementary Figs. S6–S8 for S-BCC, IR-BCC, and N-BCC samples, respectively, as the same slides represented.

