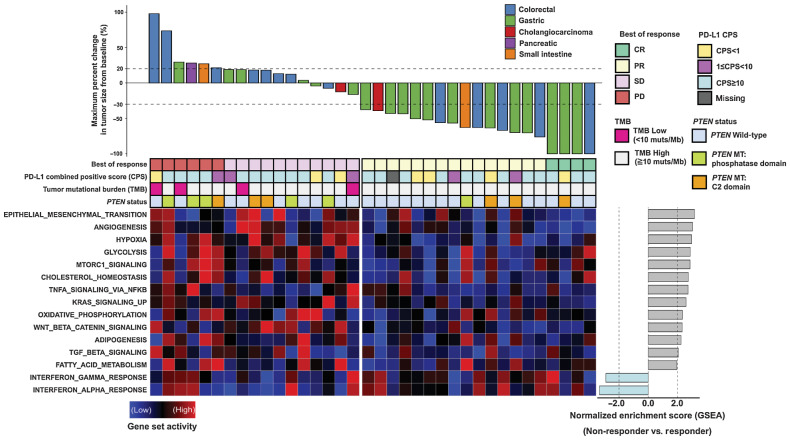
Figure 1.
Waterfall plot of the maximum percentage change in tumor size from baseline measured using the RECIST version 1.1 and gene set activity of signaling pathways between responders and non-responders. Top, percentages of maximum tumor volume changes during PD-1 blockade measured using the RECIST 1.1 criteria. The bottom dotted line represents a tumor reduction of 30%, as per RECIST 1.1, representing partial response (PR) or complete response (CR). The top dotted line represents a tumor increase of more than 20%, representing disease progression (PD). Middle, summary of best of response, combined positive score (CPS), tumor mutational burden (TMB), and PTEN mutation status. Each column represents an individual patient with available data. Bottom left, a heat map showing the relative expression levels of associated gene sets between samples calculated using the gene set variation analysis (GSVA). Bottom right, a bar plot representing normalized enrichment score between responders and non-responders for each gene set calculated using the gene set enrichment analysis (GSEA).

