. 2022 Apr 26;28(13):2818–2829. doi: 10.1158/1078-0432.CCR-22-0112

Figure 1.

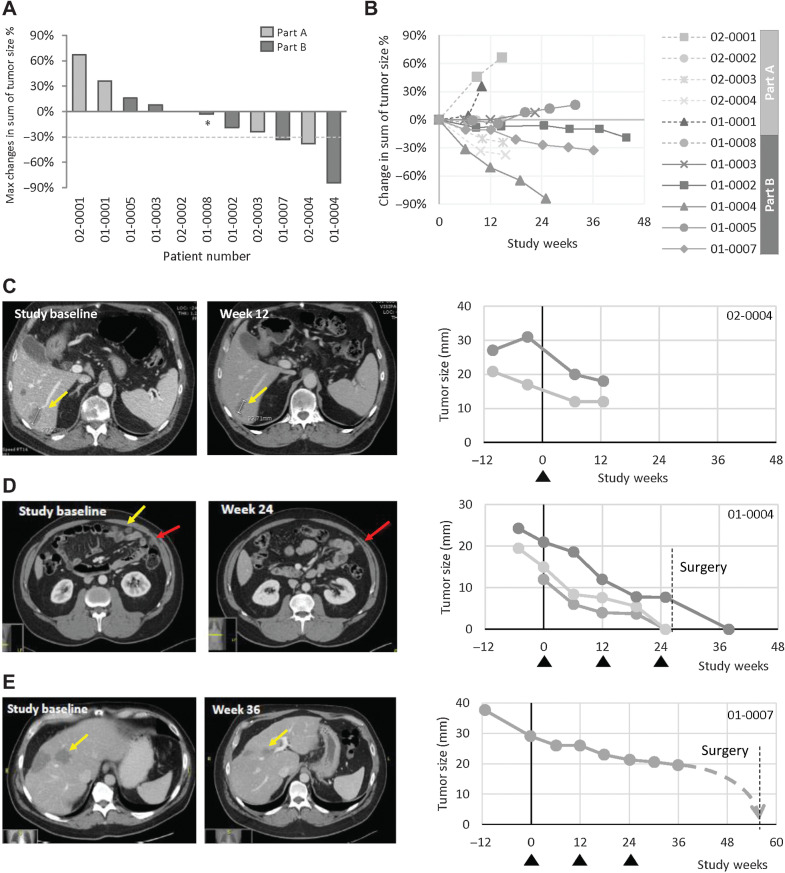
Figure 1. Antitumor activity. A, Maximum changes from baseline in sum of target lesion size. B, Spider plot showing the changes of the target lesion sizes at each radiologic assessment (6-weekly). Each data point was compared with the lesion size measured at baseline. Dotted lines indicate patients receiving a single dose. CT scans and individual target lesion size changes for Patient 02–0004 (C), Patient 01–0004 (D), and Patient 01–0007 (E). Dotted lines denote post-study data for Patient 01–0007. Triangles indicate vaccination dates. Different gray shades on the line graphs and different colored arrows on the scans indicate different target lesions of the patients. *This patient was considered with PD due to clinical progression by the investigator.

Antitumor activity. A, Maximum changes from baseline in sum of target lesion size. B, Spider plot showing the changes of the target lesion sizes at each radiologic assessment (6-weekly). Each data point was compared with the lesion size measured at baseline. Dotted lines indicate patients receiving a single dose. CT scans and individual target lesion size changes for Patient 02–0004 (C), Patient 01–0004 (D), and Patient 01–0007 (E). Dotted lines denote post-study data for Patient 01–0007. Triangles indicate vaccination dates. Different gray shades on the line graphs and different colored arrows on the scans indicate different target lesions of the patients. *, This patient was considered with PD due to clinical progression by the investigator.