. 2022 Feb 11;28(8):1595–1602. doi: 10.1158/1078-0432.CCR-21-1933

Figure 3.

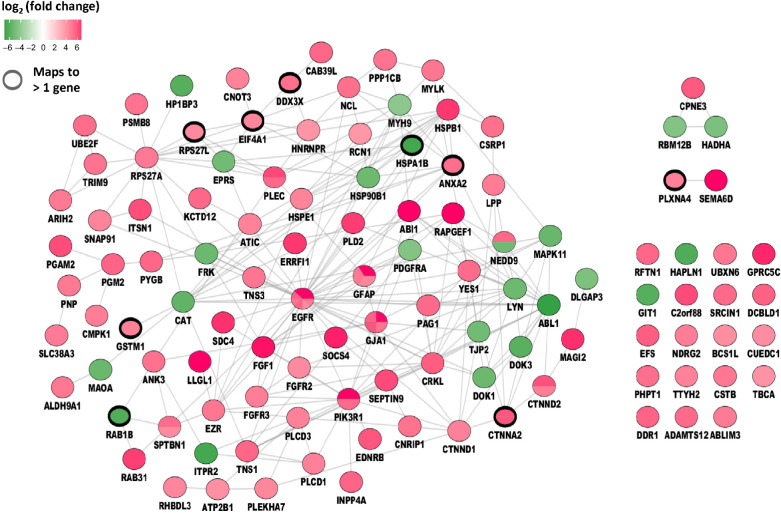
Figure 3. Protein interaction network. Protein interaction network of differential phosphopeptides (P < 0.05) between sunitinib-treated and control samples. Regulated phosphopeptides are mapped to proteins and visualized as protein interaction network. Green, Down- and Red, Upregulated in sunitinib-treated patients. Colored subdivisions indicate identification of multiple upregulated phosphopeptides mapping to the same protein. Note EGFR was identified with three upregulated phosphopeptides in the sunitinib-treated group.

Protein interaction network. Protein interaction network of differential phosphopeptides (P < 0.05) between sunitinib-treated and control samples. Regulated phosphopeptides are mapped to proteins and visualized as protein interaction network. Green, Down- and Red, Upregulated in sunitinib-treated patients. Colored subdivisions indicate identification of multiple upregulated phosphopeptides mapping to the same protein. Note EGFR was identified with three upregulated phosphopeptides in the sunitinib-treated group.