. 2022 Feb 11;28(8):1595–1602. doi: 10.1158/1078-0432.CCR-21-1933

Figure 4.

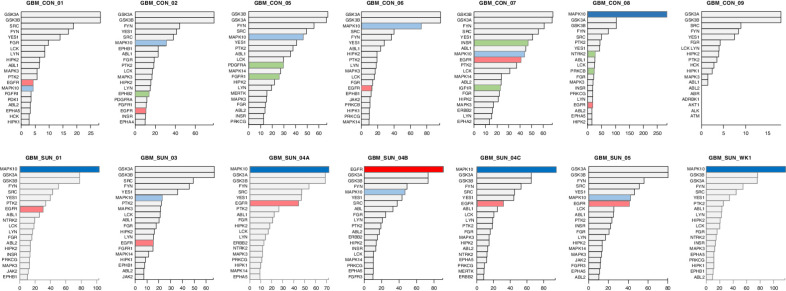
Figure 4. Ranking of top 20 active kinases in tumors from 11 patients with glioblastoma. Ranked kinase activities in 7 control and 4 sunitinib-treated tumors. For each tumor, bar graphs depict kinase ranking based on combined INKA scores of kinase- and substrate-centric analysis of tyrosine-phoshoproteomics (12). For patient SUN-04, three biological replicates have been analyzed. Top bars of potential hyperactive kinases are highlighted by dark coloring (MAPK10 blue, EGFR red). Note the very high INKA score for MAPK10 in patient CON-08. Light blue and red colored bars indicate lower ranked MAPK10 and EGFR kinase activities, respectively. Green colors highlight kinases with “outlier activity”, i.e., higher activity in one versus the remaining 10 tumors (see Supplementary Fig. S3). SUN, sunitinib-treated; CON, control.

Ranking of top 20 active kinases in tumors from 11 patients with glioblastoma. Ranked kinase activities in 7 control and 4 sunitinib-treated tumors. For each tumor, bar graphs depict kinase ranking based on combined INKA scores of kinase- and substrate-centric analysis of tyrosine-phoshoproteomics (12). For patient SUN-04, three biological replicates have been analyzed. Top bars of potential hyperactive kinases are highlighted by dark coloring (MAPK10 blue, EGFR red). Note the very high INKA score for MAPK10 in patient CON-08. Light blue and red colored bars indicate lower ranked MAPK10 and EGFR kinase activities, respectively. Green colors highlight kinases with “outlier activity”, i.e., higher activity in one versus the remaining 10 tumors (see Supplementary Fig. S3). SUN, sunitinib-treated; CON, control.