. 2022 Jan 28;28(7):1383–1390. doi: 10.1158/1078-0432.CCR-21-2080

Figure 2.

Figure 2. Kaplan–Meier curves for duration of radiographic PFS by IRF assessment—ITT population evaluable for PFS and gLOH. Chemo, chemotherapy; cum, cumulative; ev, events; REF, reference; TALA, talazoparib. aHigher and lower indicate that gLOH is above or below the median, respectively. HR is based on unstratified Cox regression model and is relative to talazoparib gLOH < median or chemotherapy gLOH < median with <1 favoring higher gLOH.

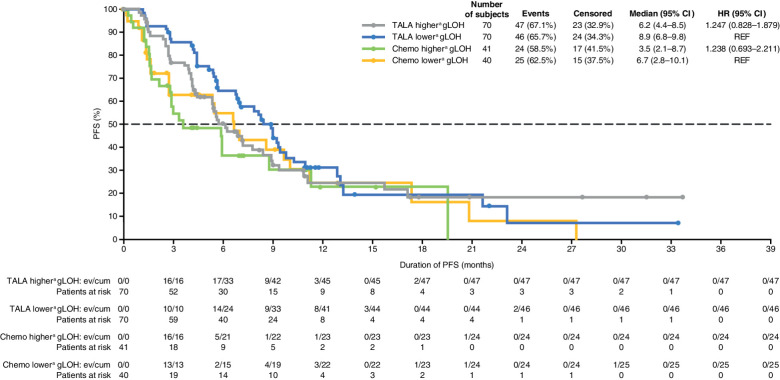
Kaplan–Meier curves for duration of radiographic PFS by IRF assessment—ITT population evaluable for PFS and gLOH. Chemo, chemotherapy; cum, cumulative; ev, events; REF, reference; TALA, talazoparib. aHigher and lower indicate that gLOH is above or below the median, respectively. HR is based on unstratified Cox regression model and is relative to talazoparib gLOH < median or chemotherapy gLOH < median with <1 favoring higher gLOH.